
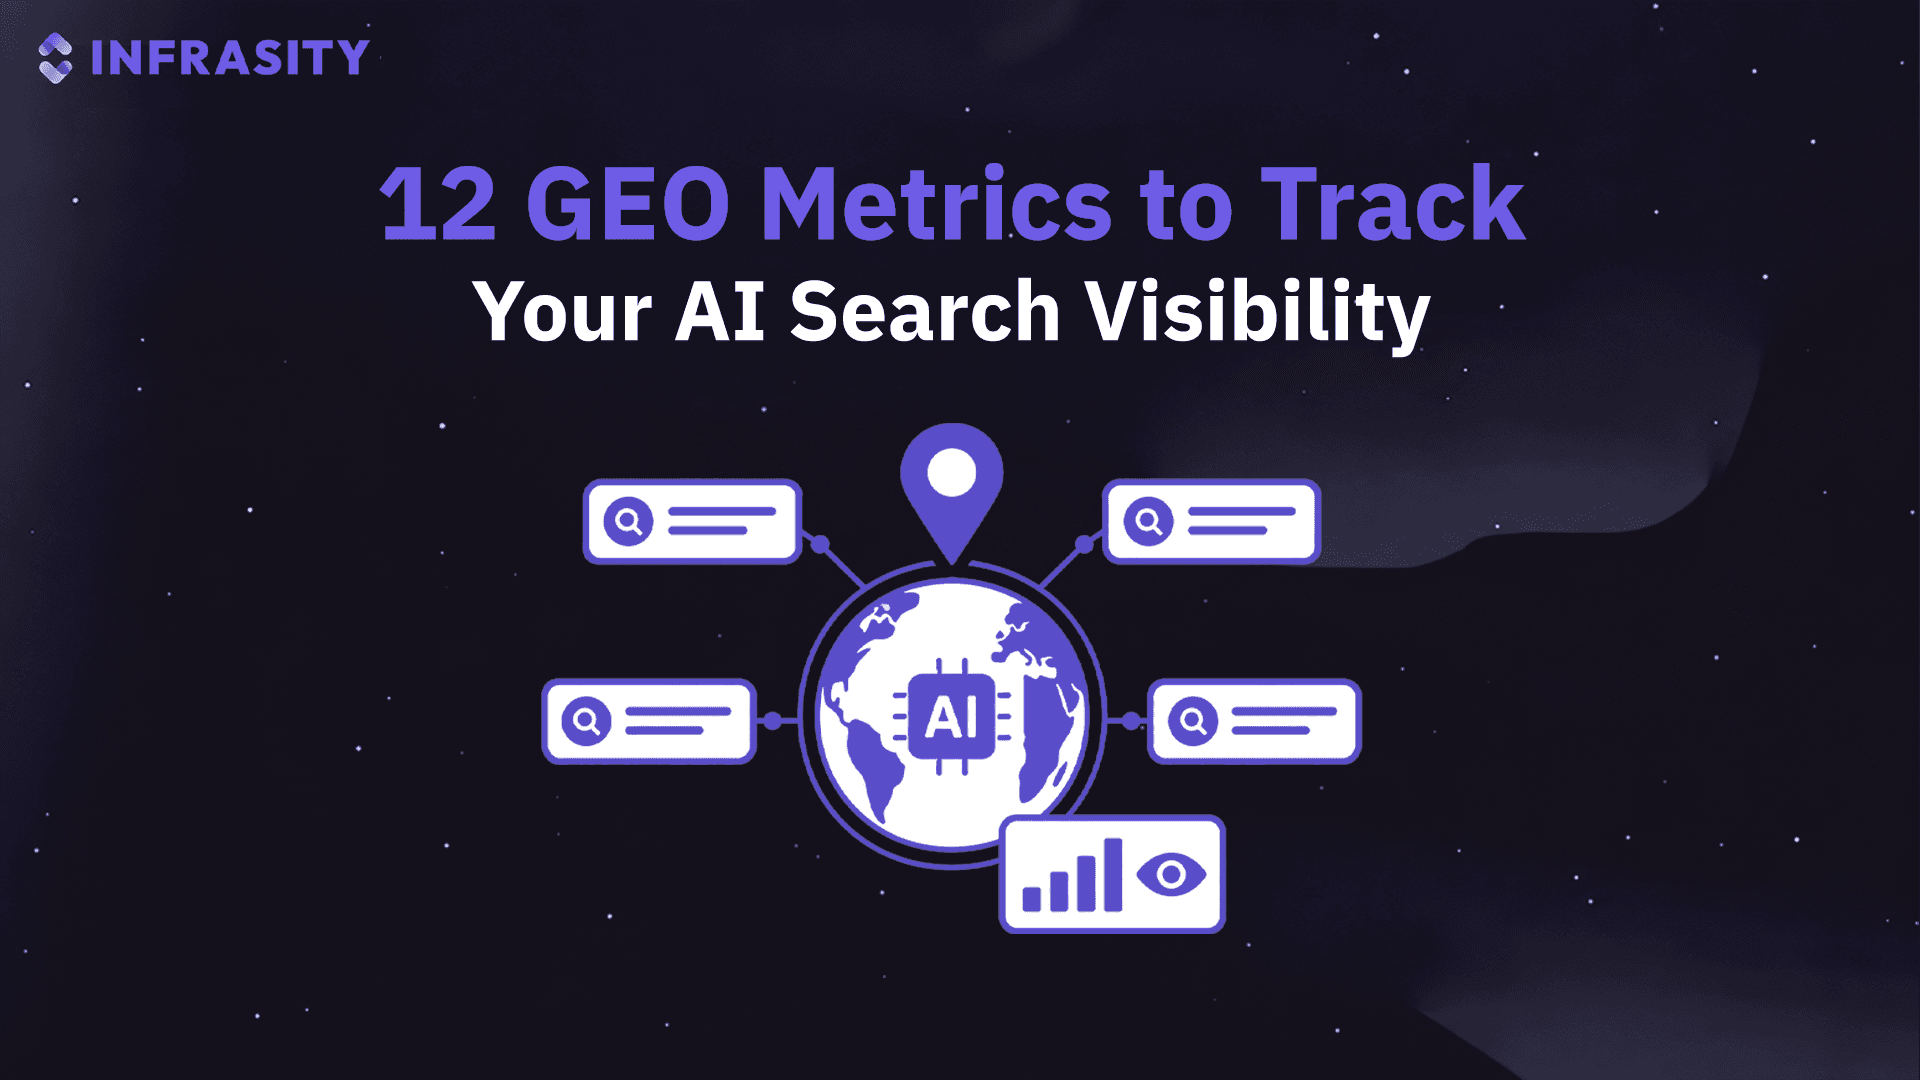
GEO metrics measure how often your brand appears in AI-generated answers, earns citations, gets recommended over competitors, and attracts qualified traffic from AI search platforms. For DevTool companies, these metrics reveal whether tools such as ChatGPT, Perplexity, and Google AI Overviews recognize and recommend their products.
The need to track this visibility is growing. A 2025 Pew Research Center study found that users clicked traditional search results in just 8% of searches featuring an AI summary, compared with 15% without one.
This blog covers 12 GEO metrics to help you track AI visibility, citations, recommendations, referral traffic, and pipeline impact.
TL;DR
- Track AI visibility rate, share of voice, and prompt coverage to see whether ChatGPT, Perplexity, and Google AI Overviews mention your brand across buyer queries.
- Measure citation rate, entity accuracy, and recommendation rate to find out whether AI engines trust your content and recommend your product over competitors.
- Track referral traffic, branded search lift, and pipeline contribution to connect AI visibility with qualified signups, trials, and revenue.
- Run prompts 5–10 times per engine using a fixed query set. Report visibility ranges instead of trusting a single AI response.
- Tie every weak metric to a specific fix, from updating documentation to publishing comparison pages and correcting outdated third-party mentions. Review results monthly.
12 GEO Metrics to Track Your AI Search Visibility In 2026
Generic SEO dashboards don't capture how AI models cite, recommend, or ignore your product. These 12 GEO metrics fill that visibility gap.
1. AI Visibility Rate
AI Visibility Rate is the share of AI answers that name your brand. Of all AI search optimization GEO metrics, baseline it first. If it sits near zero, nothing else has data to measure.
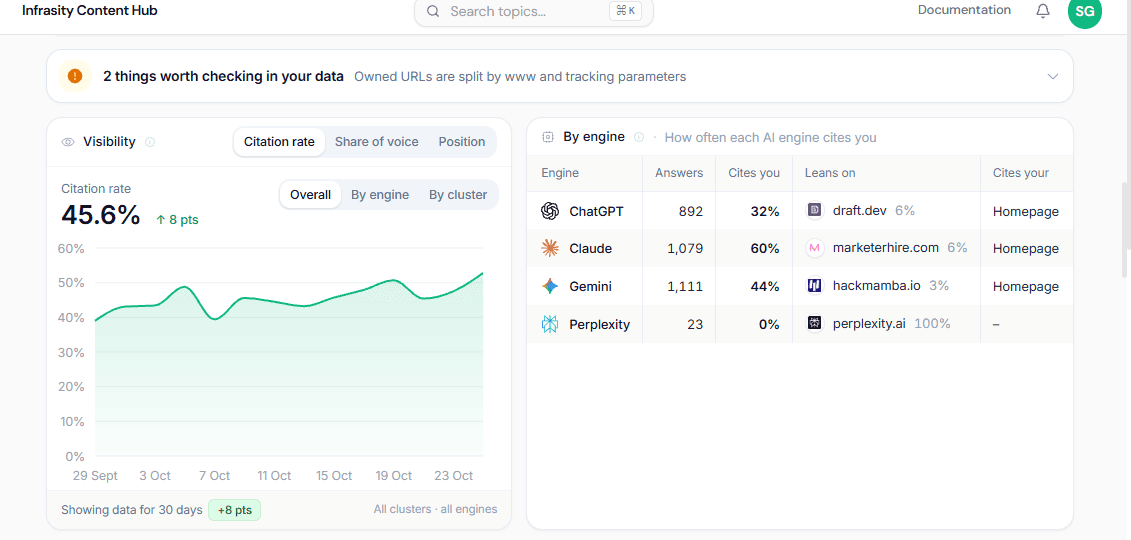
A visibility dashboard reports a rate per engine, since ChatGPT, Claude, Gemini and Perplexity differ.
Divide answers that mention you by total answers, then multiply by 100. Calculate it per engine, since ChatGPT, Perplexity, and Google AI Mode pull from different sources.
For example, a CI/CD tool like CircleCI should track prompts like "best CI/CD tools for monorepos." If CircleCI appears in 30 out of 100 relevant prompts, that's a 30% visibility rate.
2. AI Share of Voice
This metric compares your visibility rate against competitors in the same query set. If three competitors split 70% of mentions and you get 10%, you have a share-of-voice problem.
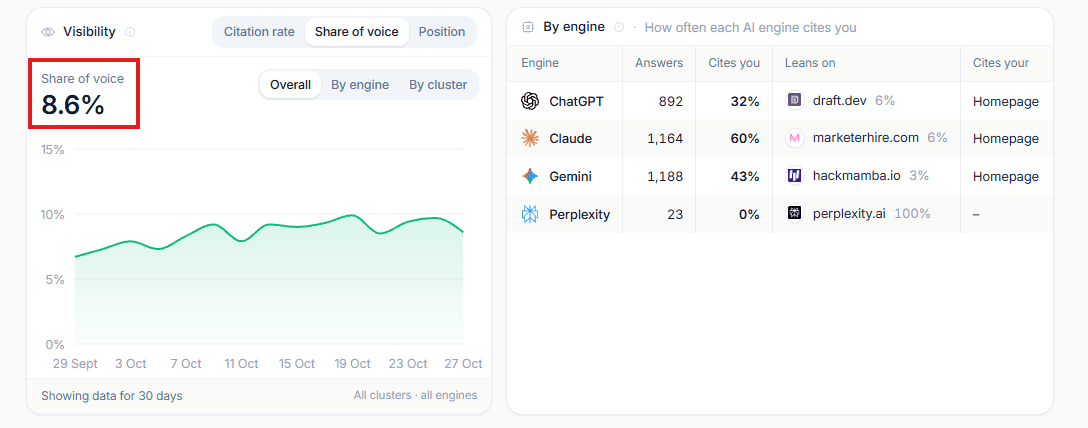
Share of voice tracked over 30 days: the brand holds 8.6% of mentions in the tracked query set.
Postman, Insomnia, and Bruno compete for API-testing queries. Tracking their relative mention frequency shows who's winning AI search optimization GEO metrics battles in that category.
Pull this data monthly using tools that query multiple AI models simultaneously and log competitor mentions. Manual tracking through spreadsheets works for smaller query sets under 50 prompts.
3. Citation Rate
Citation Rate tracks how often AI models cite your documentation, blog posts, or GitHub repos as sources. This differs from brand mentions because citations show AI models trust your content enough to reference it directly. Ahrefs analyzed 100,000 keywords and found a strong correlation between high organic rankings and citation in Google's AI Overviews. Strong technical SEO still feeds GEO metric performance, even in AI-driven search.
Check citation rate by searching your exact documentation URLs or unique phrases within AI chat interfaces. If your API reference doesn't surface, your content lacks the structure AI crawlers prioritize.
4. Prompt Coverage
Prompt Coverage is the share of your tracked buyer prompts where you appear at all. It exposes topic gaps that an average visibility rate hides. A brand can win ten prompts and vanish from forty.
Count a prompt as covered when you appear in at least 2 of 5 runs. That threshold is our suggestion, so keep yours fixed. Track coverage across prompt intent:
- Problem-aware: “How do I add distributed tracing to a Go service on Kubernetes?”
- Comparison: “Best open-source alternative to a hosted error tracker?”
- Integration: “Does this work with Next.js and Vercel?”
- Pricing: “Cost of self-hosting versus the cloud plan?”
Write prompts long. Google reported in March 2026 that AI Mode queries average three times the length of traditional searches. Say an API gateway startup covers 70% of integration prompts but 0% of comparison prompts. It needs two honest comparison pages, not more blog posts.
5. AI Brand Sentiment
AI Brand Sentiment measures how AI describes your brand: positive, neutral, or negative. A negative mention can cost more than silence, so it deserves its own score.
Sample 30-50 AI responses mentioning your brand monthly. Note the sentiment: Does Perplexity call your API "well-documented" or "hard to integrate"?
Negative sentiment patterns often trace back to outdated documentation or unresolved GitHub issues. AI models pull context from recent discussions, so community sentiment directly shapes this GEO metric.
6. AI Recommendation Rate
AI Recommendation Rate counts how often an engine recommends you as a fit, not just lists you. Developers act on recommendations. A mention buried in a ten-item list rarely changes a decision.
Count prompts where you land in the first three options, then divide by all recommendation-intent prompts. Use “top three” because exact order is unstable, as the SparkToro research above shows. Segment by use case: self-hosted, serverless, enterprise SSO, and open source.
The segments expose positioning gaps. A vector database recommended for self-hosting but never for serverless needs a serverless use-case page, not more content. State who should not use you. Developers trust named trade-offs, and answer engines get something specific to quote.
7. Entity Recognition and Authority
Entity recognition checks whether AI engines know who you are, what you build, and who you compete with. Authority checks whether they trust you on your core topics.
Run 10 brand-only prompts, like “What is [Tool]?” and “[Tool] vs [Competitor].” Check each answer for these four facts:
- Category and core use case.
- Pricing model.
- License, especially open source versus proprietary.
- Key integrations.
Wrong answers usually trace to inconsistent sources. A tracing tool labeled a “logging platform” by an old tagline needs the fix everywhere: GitHub README, docs, LinkedIn, and Crunchbase. Add Organization schema with sameAs links.
Authority comes mostly from off-site presence. Ahrefs studied 75,000 brands and found branded web mentions correlated most strongly with AI Overview visibility. Pick three topic clusters, such as OpenTelemetry, and track the share of cluster prompts where you are cited.
8. Media Influence Index
This metric tracks how third-party coverage, like TechCrunch articles or YouTube reviews, shapes AI-generated responses about your product. AI models weight authoritative media sources heavily when forming answers.
If a well-known developer YouTuber reviews your API and calls it "the fastest in its category," that framing often appears in AI responses for months afterward.
Track media mentions through Google Alerts, then cross-reference with AI query results. A spike in press coverage should correlate with improved AI visibility rate within 2-4 weeks.
9. AI Referral Traffic and Engagement
AI Referral Traffic measures actual visitors arriving from AI platforms like Perplexity or ChatGPT's browsing feature. Google Analytics 4 added "Generative AI" as a default channel group in 2024, making this traffic easier to isolate.
Compare engagement metrics for AI-referred visitors against organic search visitors using:
- Average session duration
- Pages per session
- Documentation page depth
Devtool companies often see higher engagement from AI referrals since users arrive with specific, pre-qualified intent. If AI referral visitors spend 3x longer on documentation pages than average, that signals strong product-query alignment worth replicating in content strategy.
10. Third-Party Source Share and Citation Quality
This metric tracks which third-party sites AI models cite most often for your category, and whether your content appears among top cited sources. Low-quality citations hurt brand credibility even when visibility rate looks healthy.
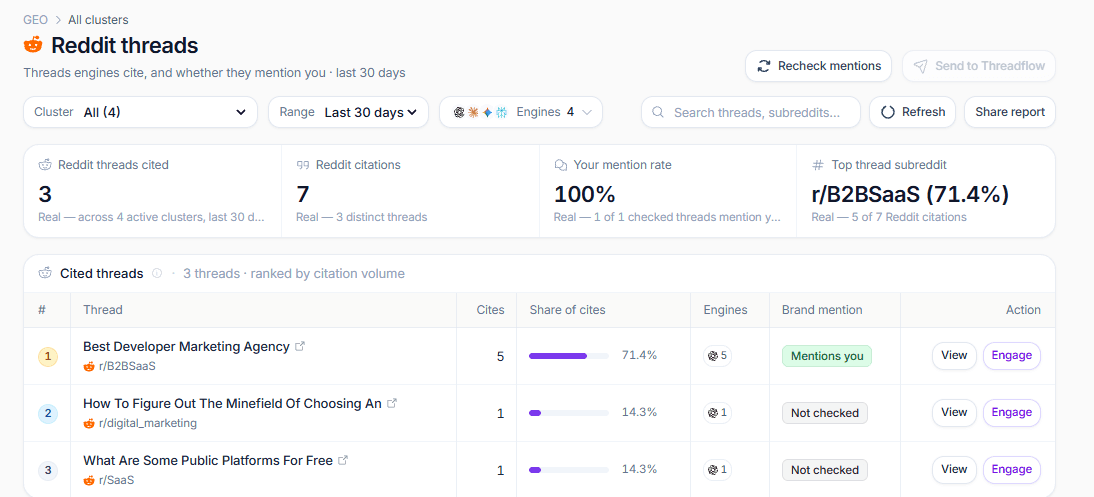
Third-party sources AI cites for a category: three Reddit threads, one carrying 71% of citations.
If AI models consistently cite a five-year-old Medium post over your updated documentation, you have a citation quality gap. Update and promote current content to win that citation slot.
Monitor this using any top website traffic checker with GEO metrics 2026 capability that tracks citation sources alongside traffic data. Infrasity's AEO services handle this directly, auditing citation gaps and rebuilding content to win back authority from outdated third-party sources.
11. Branded Search Lift
Branded search lift tracks growth in searches for your product name after AI visibility improves. Many developers see a tool in an answer, then search for it by name. This metric catches influence that never produces a click.
In Search Console, filter queries with a brand regex. Include misspellings and patterns like “[tool] pricing,” “[tool] docs,” and “[tool] vs.” Compare 28 days before and after a visibility gain, excluding launch weeks and paid campaigns. Treat the result as correlation, since known brands also get mentioned more.
Then check where the lift comes from. The country report, or any top website traffic checker with GEO metrics 2026, shows whether demand is rising in markets you target. A 22% rise in “[tool] pricing” queries after a docs rewrite, with flat non-brand clicks, suggests AI answers feed brand demand.
12. Pipeline Contribution and ROI
Most GEO metrics stop at visibility. Pipeline contribution connects it to signups, trials, and revenue. Attribution leaks, so report a range with a floor and a ceiling.
- Floor: signups tracked in your GA4 AI channel.
- Ceiling: the floor plus self-reported AI-sourced signups and sales calls where the prospect cited an AI answer.
Make “How did you hear about us?” a required field. PostHog has reported that only about 10% of signups fill in an optional version. ROI is influenced pipeline value minus program cost, divided by program cost, shown at both ends.
Say 30 tracked signups plus 20 self-reported, an 8% trial-to-paid rate, and a $6,000 first-year contract. The range is $14,400 to $24,000. A range survives a finance review better than one confident number.
How to Build a GEO Measurement Framework for Reliable Results
A metric list is not a measurement system. These five steps run the 12 metrics on a stable prompt set, with clean attribution and a fixed review rhythm.
Step 1: Freeze a prompt set from real buyer questions
The prompt set decides every number you report. Build it from real developer language, then keep most of it fixed. Changing prompts monthly makes trends meaningless.
Pull 40-60 prompts from sales calls, support threads, GitHub issues, and Search Console long queries. Tag each by funnel stage, engine, and stack. Freeze 80% and rotate 20% each quarter.
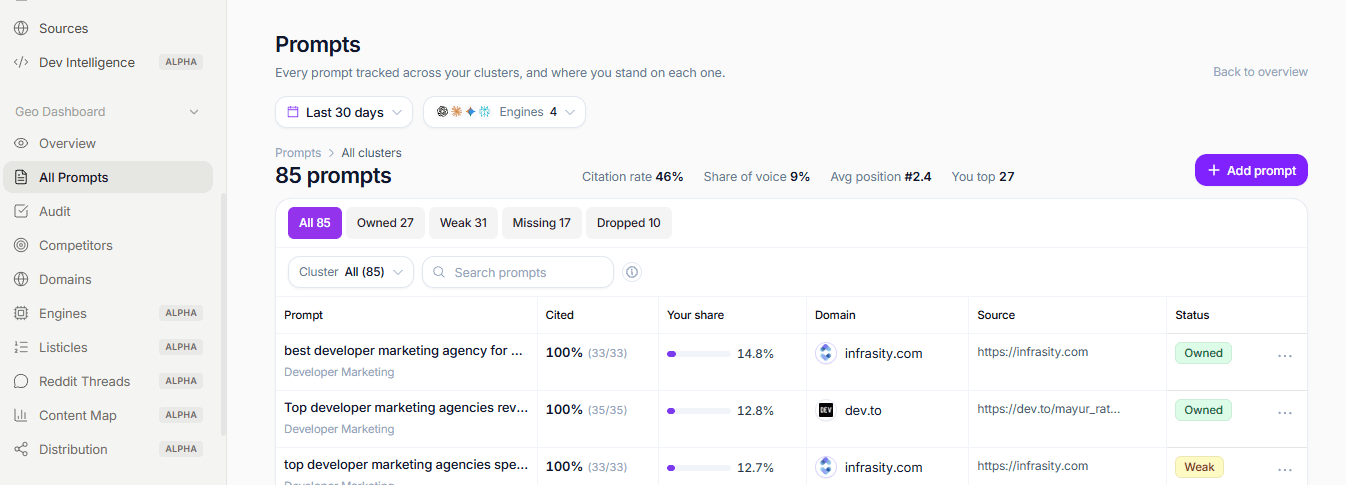
A frozen prompt set in practice: every tracked prompt with its citation rate, domain and status.
Write full questions with context, like “How do I add rate limiting to a FastAPI service behind Cloudflare?” Infrasity’s AI GEO optimization team can build this set with your engineers and sales team, so prompts match how your buyers actually ask.
Step 2: Run repeated samples and report ranges
One answer proves nothing. Run each prompt several times per engine and report frequencies with a range. Vet any tool by its published method.
Run each prompt 5-10 times in ChatGPT, Perplexity, Google AI Mode, Claude, and Copilot. Log the answer, cited URLs, and date. Report rates as ranges, such as “visibility 14-19%.”
When you shortlist a top website traffic checker with GEO metrics 2026, ask for its runs per prompt, engines covered, and sampling method. See also WARC on LLMs producing random results when listing brand recommendations.
Step 3: Wire attribution before you change anything
Baseline first, then publish. Attribution added after the work cannot show a before-and-after. Give it four weeks.
Build the GA4 AI channel, set UTM conventions for links you control, and make the self-reported field required. Turn on the Search Console generative AI reports if your property has them. Export GA4 to BigQuery. GA4 does not reclassify historical sessions when channel rules change. Your rule date starts the data series. Terminus has a guide to tracking AI referral traffic.
Infrasity’s free AEO audit tool gives a first read on how ready your pages are for answer engines.
Step 4: Map each weak metric to one specific fix
A dashboard without actions is a report card. Pair each weak metric with a named cause and one fix. The table below is a starting point.
| Weak metric | Likely cause | First fix |
|---|---|---|
| High visibility, low citation rate | Thin owned pages | Add original benchmarks, named quotes, and sourced statistics to docs |
| Low coverage on comparison prompts | No trade-off-first comparisons | Publish honest comparison pages |
| Negative sentiment tied to a thread | Old community discussion | Reply as a maintainer, update docs |
| Low entity accuracy | Inconsistent profiles | Align taglines, schema, and listings |
| Weak recommendation rate in one use case | No use-case content | Publish guides that state limits |
Infrasity’s developers write the docs and comparison content. Its Reddit marketing team handles community threads where sentiment or source gaps start.
Step 5: Review monthly and set action thresholds
Measurement only helps if someone acts on it. Hold one monthly review with three charts and pre-set triggers. Re-baseline whenever an engine ships a major model change.
Use three charts: visibility rate by engine, citation rate by page type, and the AI-sourced signup range. Our suggested triggers are a visibility drop of more than 5 points two months running, or a negative theme in over 20% of opinion-prompt runs.
Infrasity’s AI GEO optimization service can run this review and turn each trigger into a content or community task. Its GEO playbook covers the method in more depth.
Conclusion
GEO measurement comes down to frequency, authority, and revenue, measured on a stable prompt set. You do not need all 12 on day one. Start with AI visibility rate, citation rate, AI referral traffic, and pipeline contribution. Add the rest once those numbers hold steady.
Skip position tracking. Run prompts many times and report ranges. The right AI search optimization GEO metrics tell you which fix to ship next, and which one to stop funding.
Want a baseline of your devtool’s visibility across ChatGPT, Perplexity, and Google AI Mode? Book a free consultation with Infrasity. We will scope a prompt set, a metric stack, and a 90-day plan built around your product and buyers.
FAQs
What is dark traffic in AI search?
Dark traffic in AI search refers to website visits from AI platforms that analytics tools cannot clearly attribute to ChatGPT, Perplexity, or Gemini. These visits may appear as direct traffic, making AI-driven discovery harder to measure accurately.
How long does it take to see GEO results?
GEO results can take several weeks to months, depending on content quality, website authority, source credibility, and how frequently AI platforms retrieve relevant information. Timelines vary by platform, so track visibility, citations, and brand mentions consistently.
How do you fix inaccurate brand information in AI responses?
Identify incorrect claims, then update your website, product documentation, knowledge base, and business profiles with consistent, verifiable information. Strengthen trusted third-party sources and monitor responses regularly. AI platforms may take time to reflect these corrections.
What are the limitations of current GEO measurement tools?
Current GEO tools may track limited prompts, AI platforms, and response samples. Since answers change across queries and sessions, visibility estimates may be incomplete. They also cannot always establish citation influence, attribute traffic accurately, or connect AI mentions directly to conversions.
What is content decay in GEO?
Content decay in GEO occurs when previously cited or recommended content loses AI visibility because information becomes outdated, competitors publish stronger sources, or retrieval patterns change. Regularly refresh facts, examples, product details, and supporting sources to maintain relevance.