How to Read the GEO Dashboard: Citation Rate vs. Share of Voice
Track AI visibility with Content Hub MCP, and understand the difference between citation rate and share of voice before looking at any numbers.
What is AI visibility?
AI visibility (sometimes called GEO, for Generative Engine Optimization) is how often and how prominently your brand shows up when people ask AI models like ChatGPT, Claude, Gemini, and Perplexity questions relevant to your space, for example "best developer marketing agency for AI startups." As more discovery moves from typing a search query into Google to asking a chat interface directly, whether a model cites you in its answer, and where it places you among the other sources it cites, matters in much the same way organic search rankings did for traditional SEO.
Content Hub tracks this by running a defined set of prompts against multiple AI models on a recurring basis and recording who gets cited, how often, and in what position. Once Claude Desktop is connected via MCP, you can pull all of that straight into a chat.
Citation rate vs. share of voice
Two metrics come up constantly in this data, and they measure genuinely different things. It's worth understanding both before looking at any numbers, since a high score on one and a low score on the other isn't a contradiction, it's a specific, diagnosable pattern.
| Citation Rate | Share of Voice |
|---|---|
| How often you get cited at all, across every prompt run against every AI model. | Of all citations handed out in a cluster, to anyone, you or your competitors, what percentage go to you. |
| Answers: "When someone asks a relevant question, does an AI model mention me?" | Answers: "Among everyone who gets mentioned, how big a slice is mine?" |
| Expressed as a percentage of evaluations that included you, for example "cited in 464 of 985 evaluations." | Expressed as a percentage of total citation volume across all competing domains, for example "7% of all citations in this cluster." |
| A single-brand presence metric. | A relative, competitive dominance metric. |
A brand can have a high citation rate but a low share of voice at the same time, if it gets mentioned often but always alongside several other sources rather than being the standout answer. That exact pattern shows up in the walkthrough below.
Before you start, make sure a GEO cluster exists with prompts added to it, and that it has a few GEO runs completed, so there's real citation and ranking data to read.
Fetch your GEO cluster overview
Start by asking for the full picture on a specific GEO cluster, for example:
"can you fetch the data of Developer Marketing geo cluster for Infrasity org"
Claude finds the matching cluster, then returns a summary: how many prompts are tracked, how many have zero citations at all, and how many recently moved up or down in rank, plus the recurring competitor domains showing up most often even if none are formally tracked as competitors on the cluster.
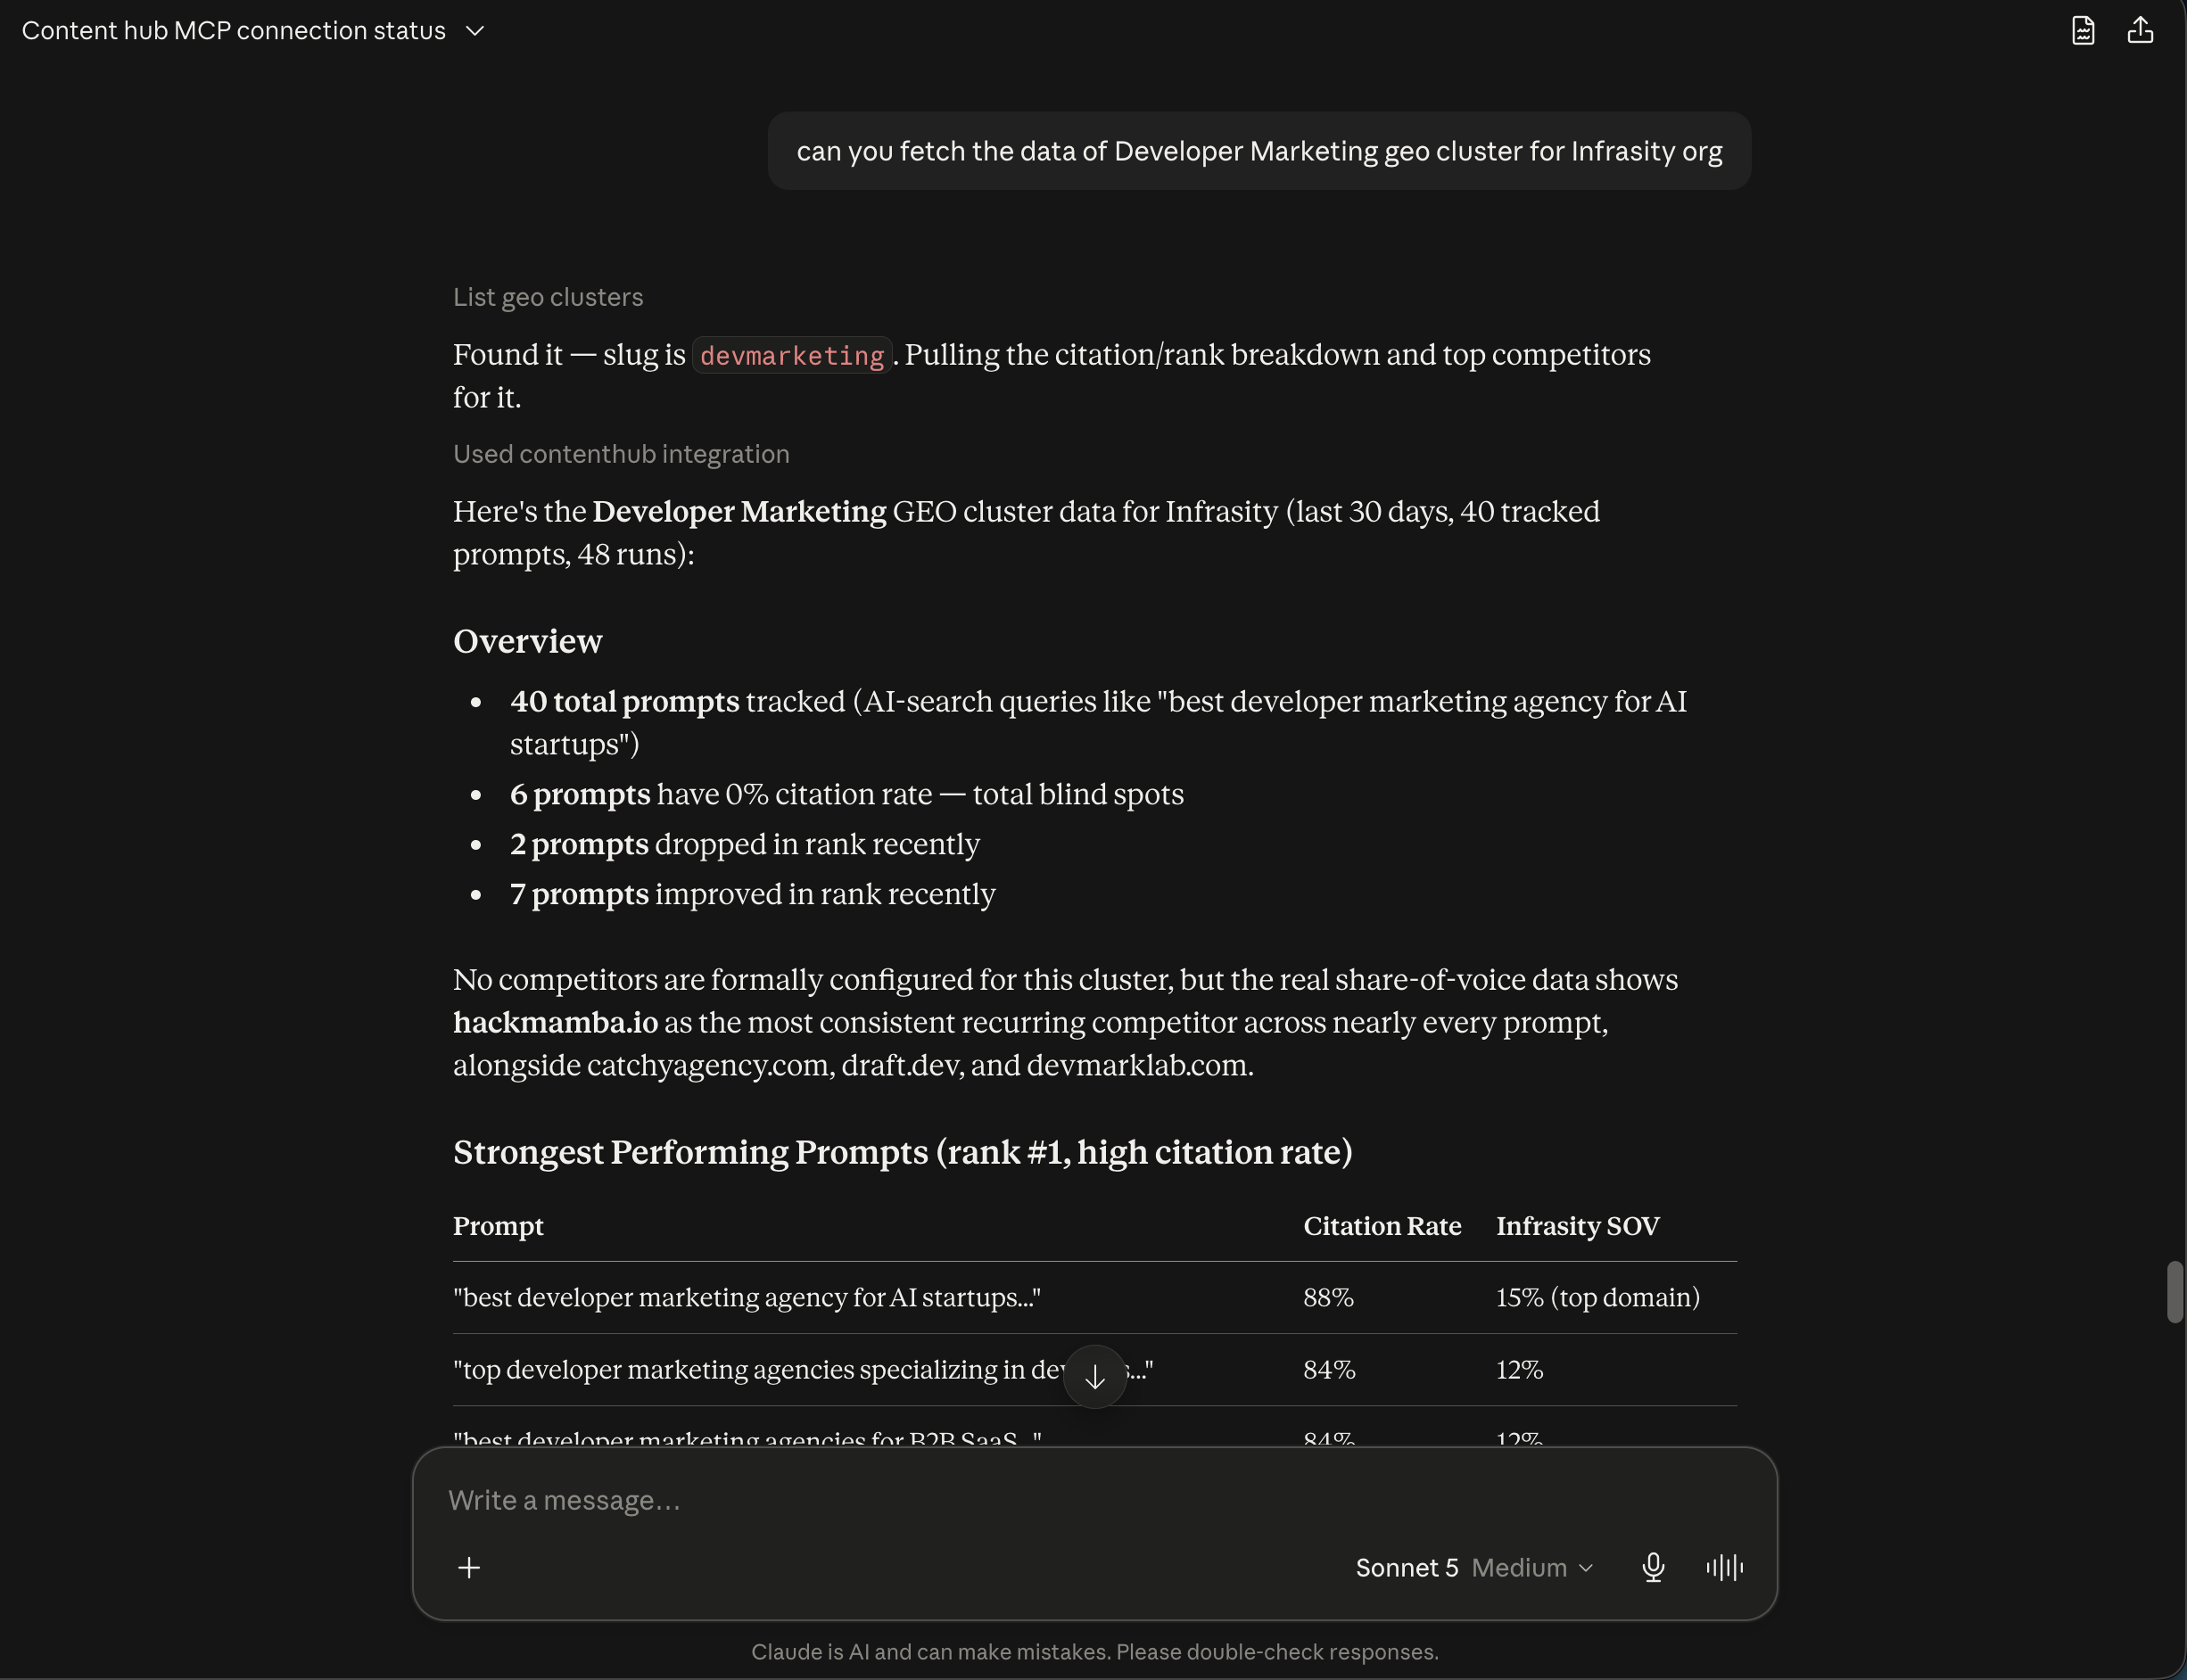
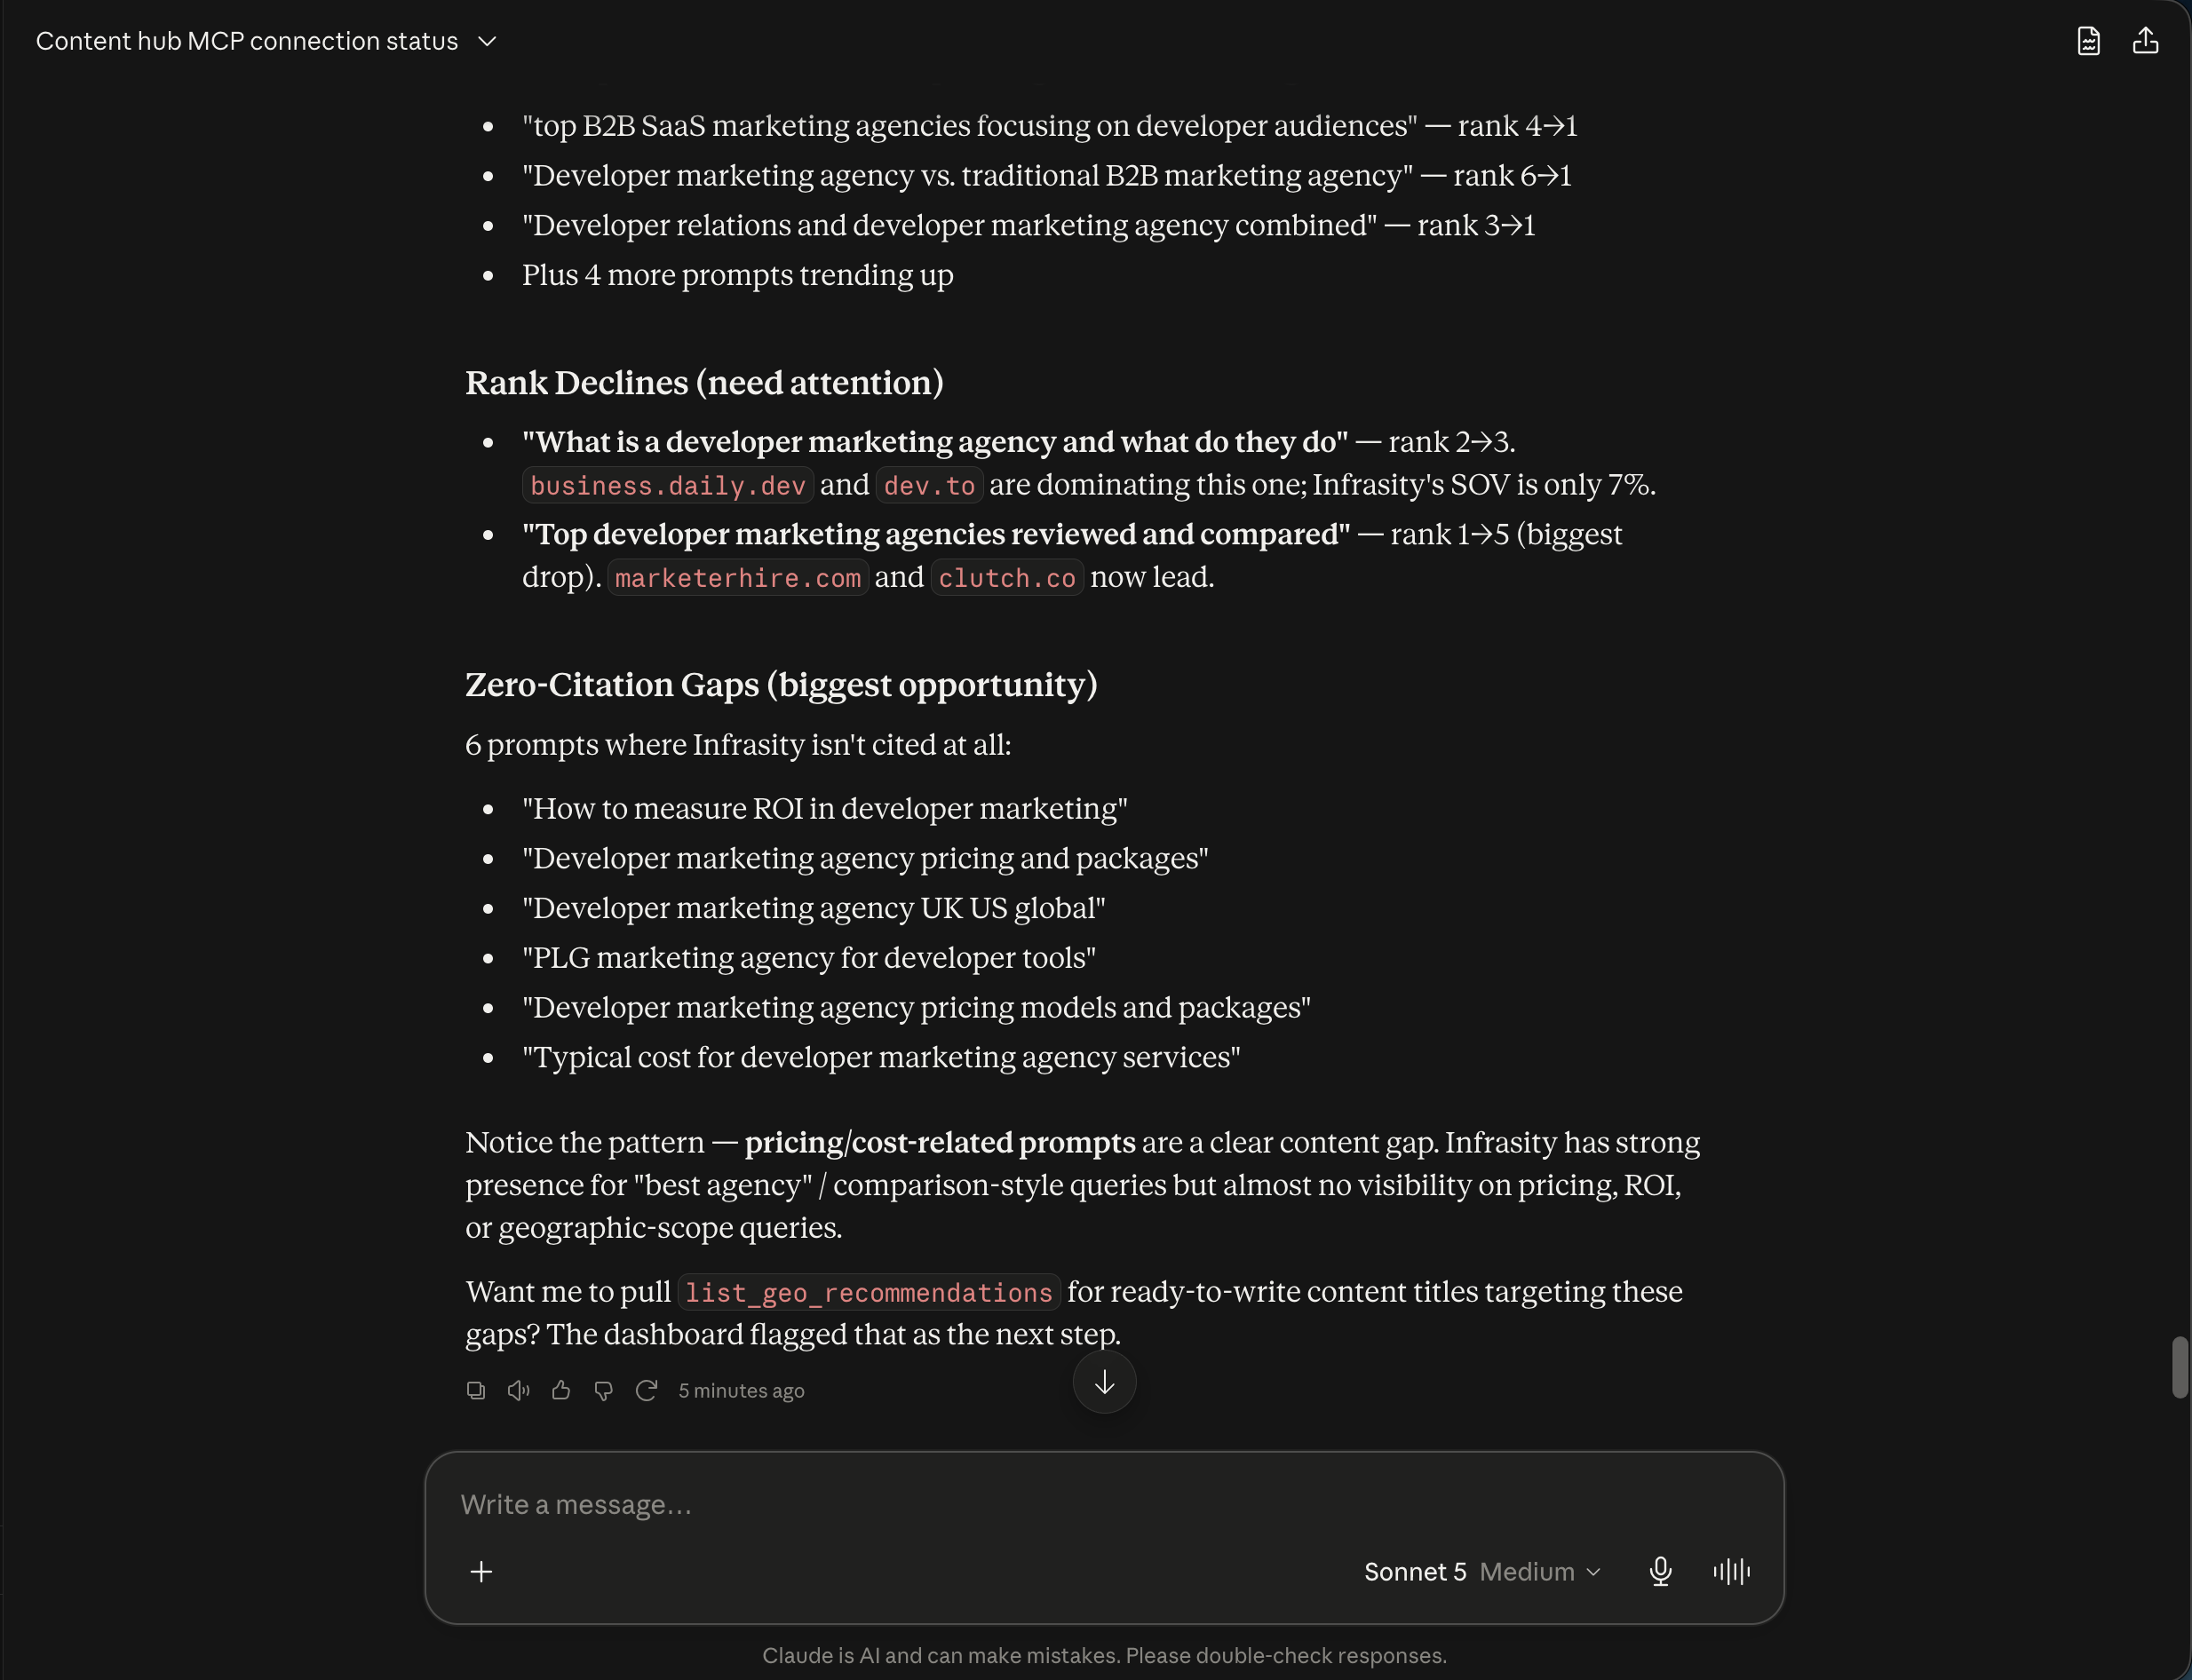
It then groups the 40 tracked prompts into three buckets: the strongest performers (rank #1, high citation rate), the rank declines that need attention (named individually with which competitor is now winning instead), and the zero-citation gaps, mostly pricing, ROI, and geographic-scope questions rather than the "best agency" queries where Infrasity already wins.
Drill into share of voice
Ask specifically for the share of voice number, for example:
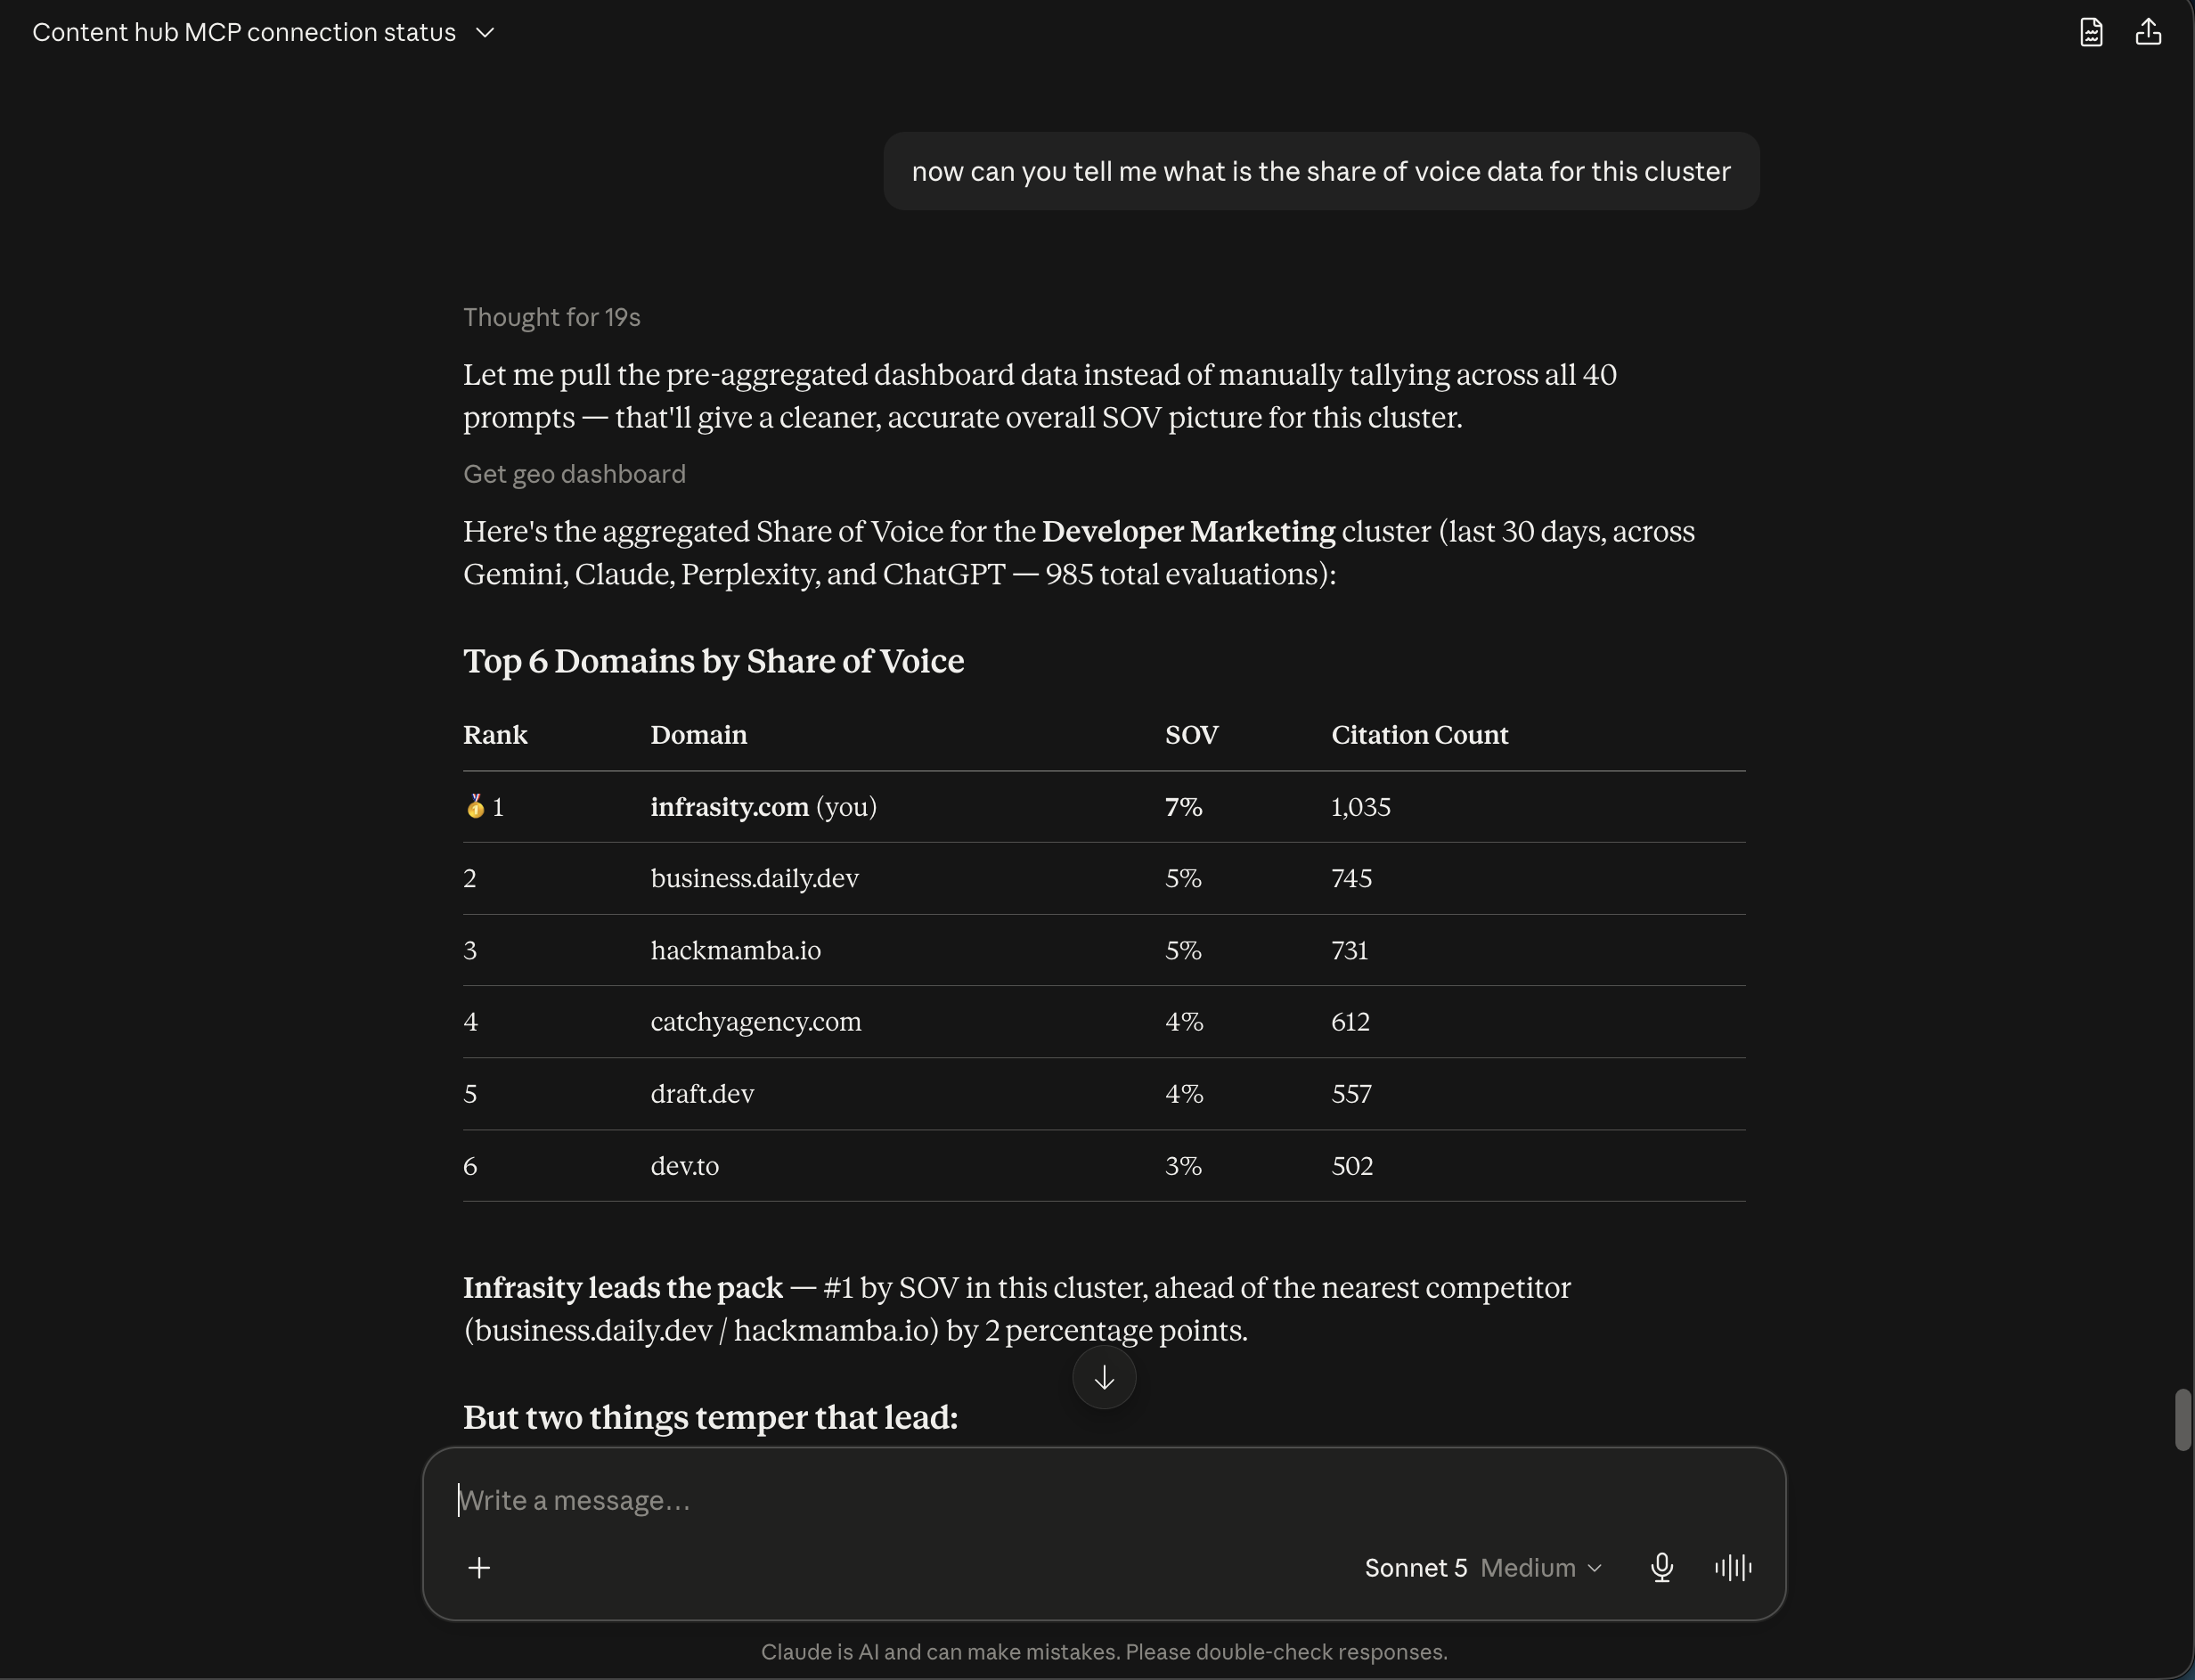
"now can you tell me what is the share of voice data for this cluster"
Claude pulls the pre-aggregated dashboard data rather than manually tallying across every prompt, and returns a ranked domain table: Infrasity leads at 7% share of voice, ahead of the nearest competitor by 2 points.
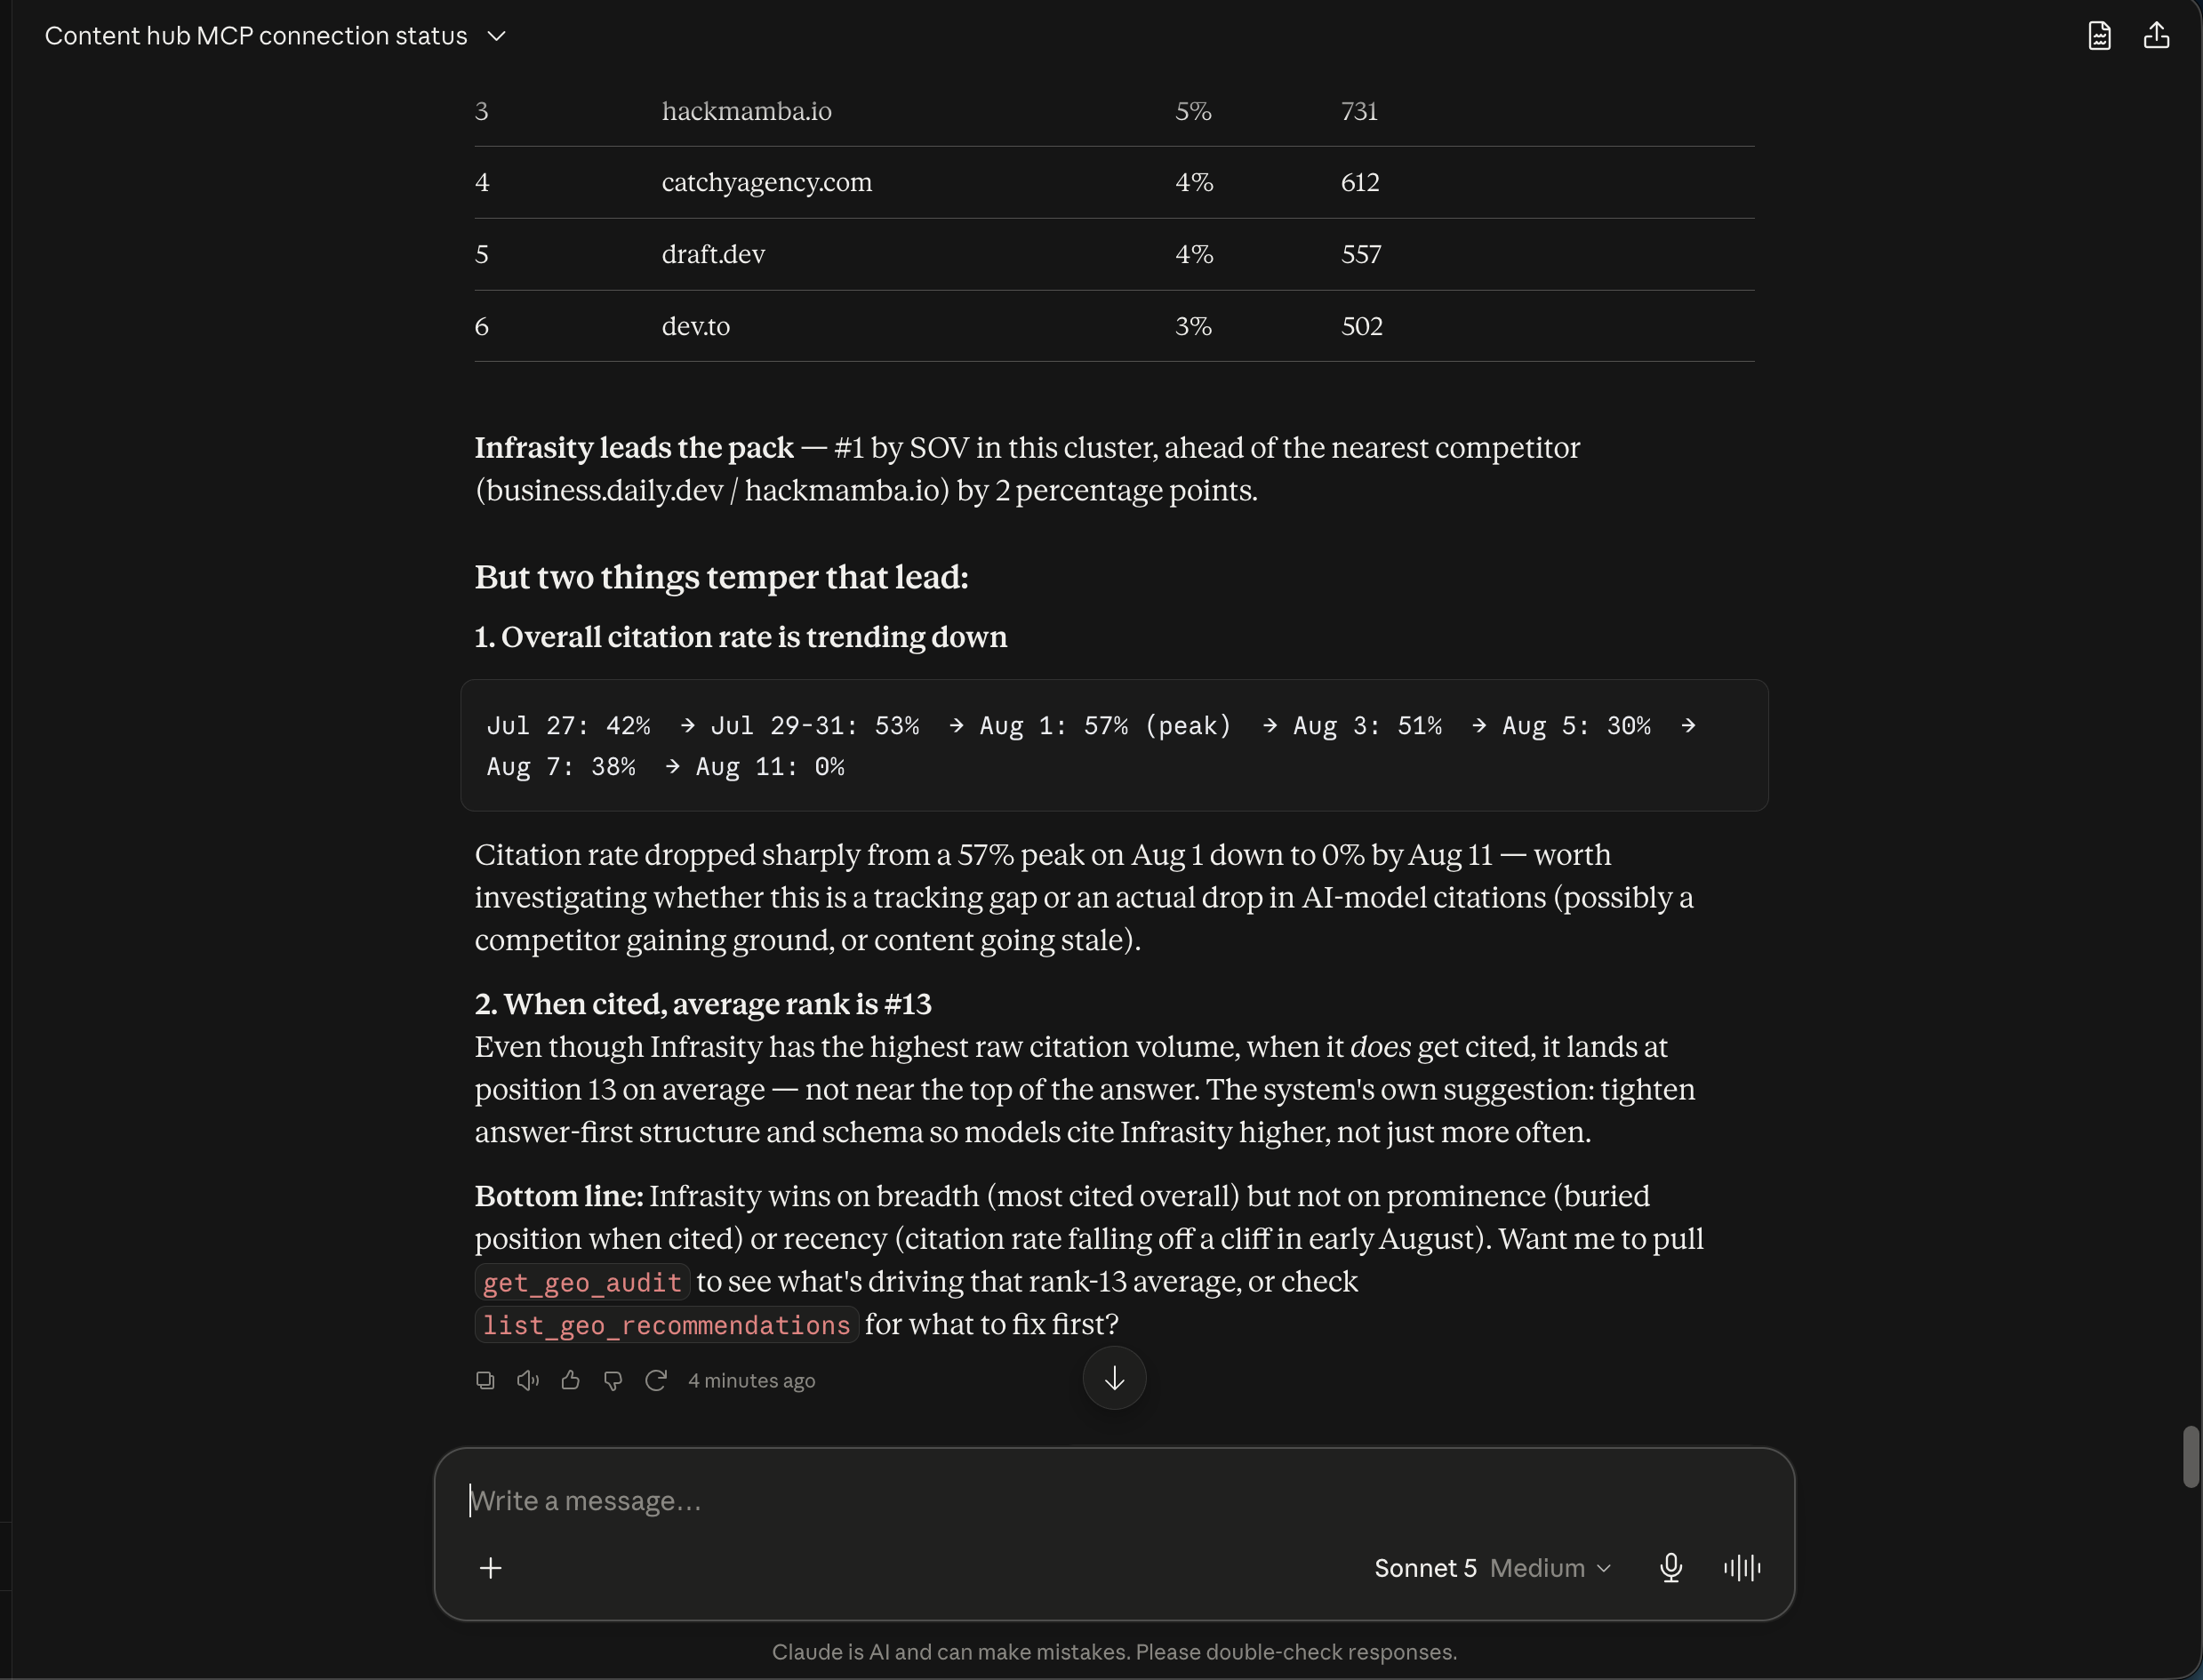
It doesn't stop at the win. Two caveats temper it: the citation rate behind that lead has been falling sharply in recent days, and even when Infrasity is cited, its average rank in the answer is #13, far from the top. The bottom line: Infrasity wins on breadth, not on prominence or recency.
Drill into citation rate
Ask specifically for the citation rate number, for example:
"also fetch the citation rate of Infrasity for this cluster"
Since this data was already pulled as part of the dashboard call, Claude reuses it: Infrasity is cited in 47% of evaluations (464 of 985) over the last 30 days.
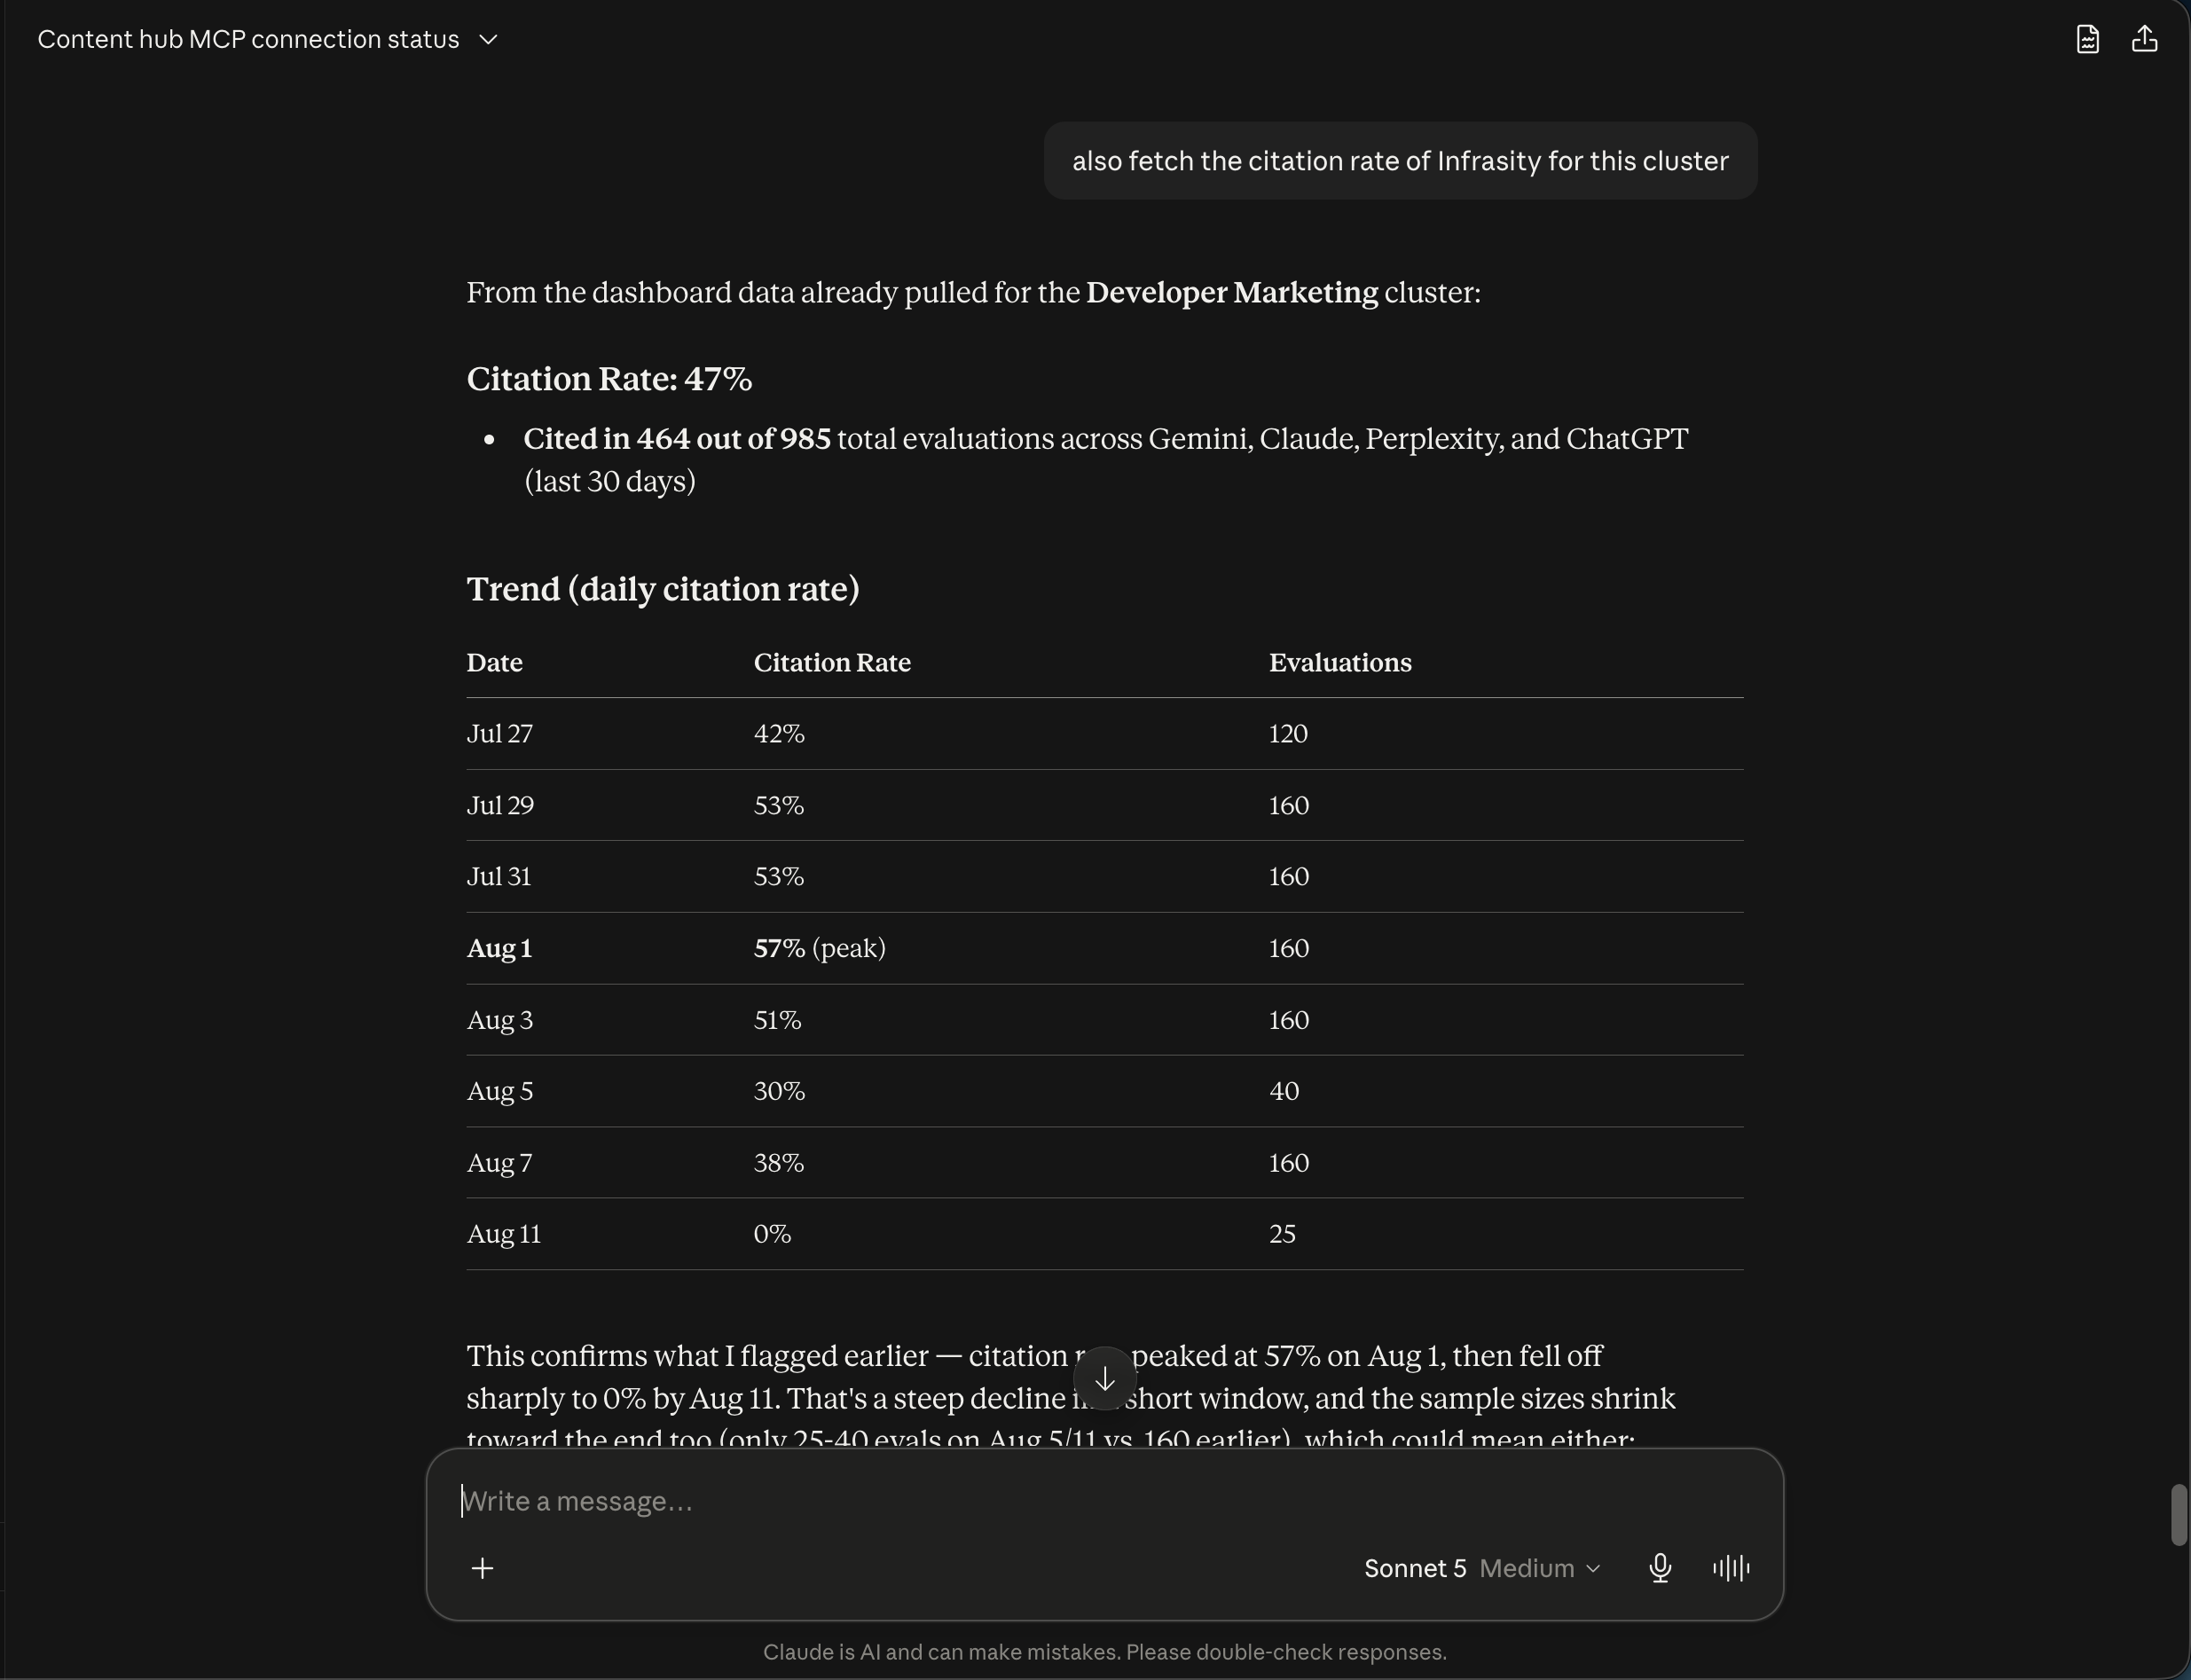
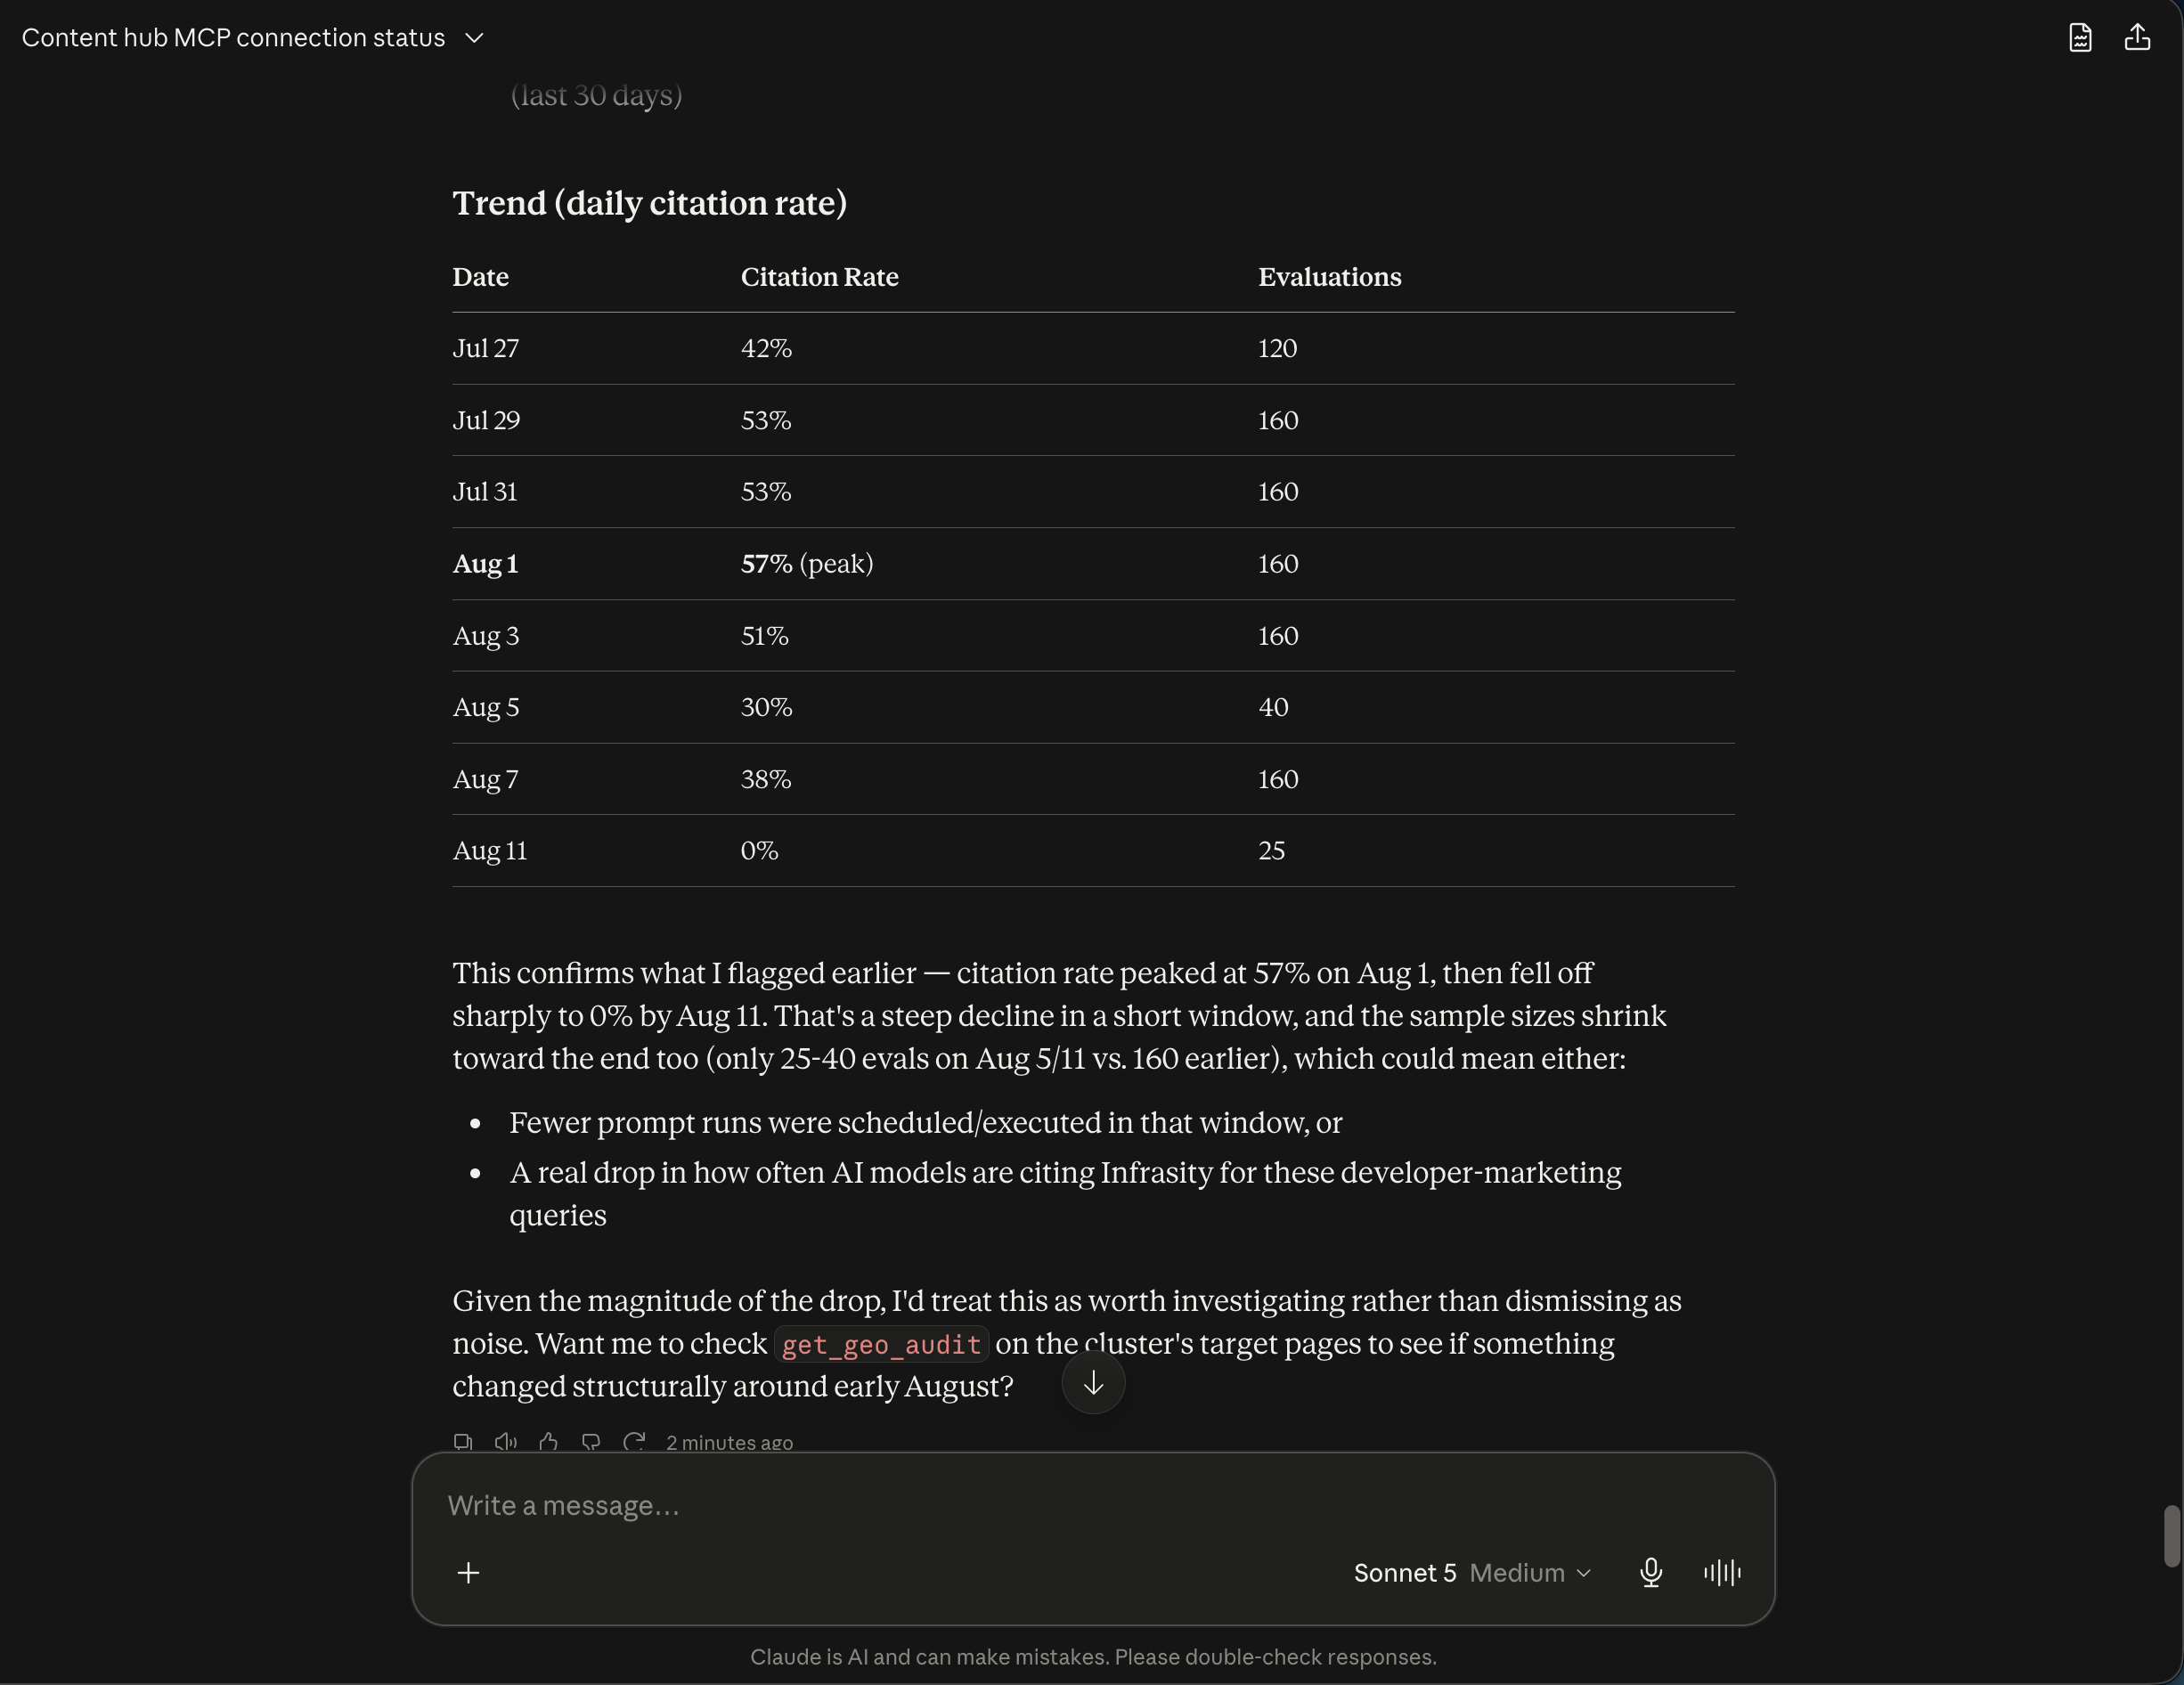
It then shows the day-by-day trend behind that average: a peak of 57% in late July, falling to 0% within a couple of weeks, with sample sizes shrinking toward the end too. Claude offers two honest explanations rather than picking one, either fewer prompt runs were scheduled in that window, or citations genuinely dropped, and flags it as worth investigating either way.
Compare both metrics and get takeaways
With both numbers already in the conversation, ask Claude to put them side by side, for example:
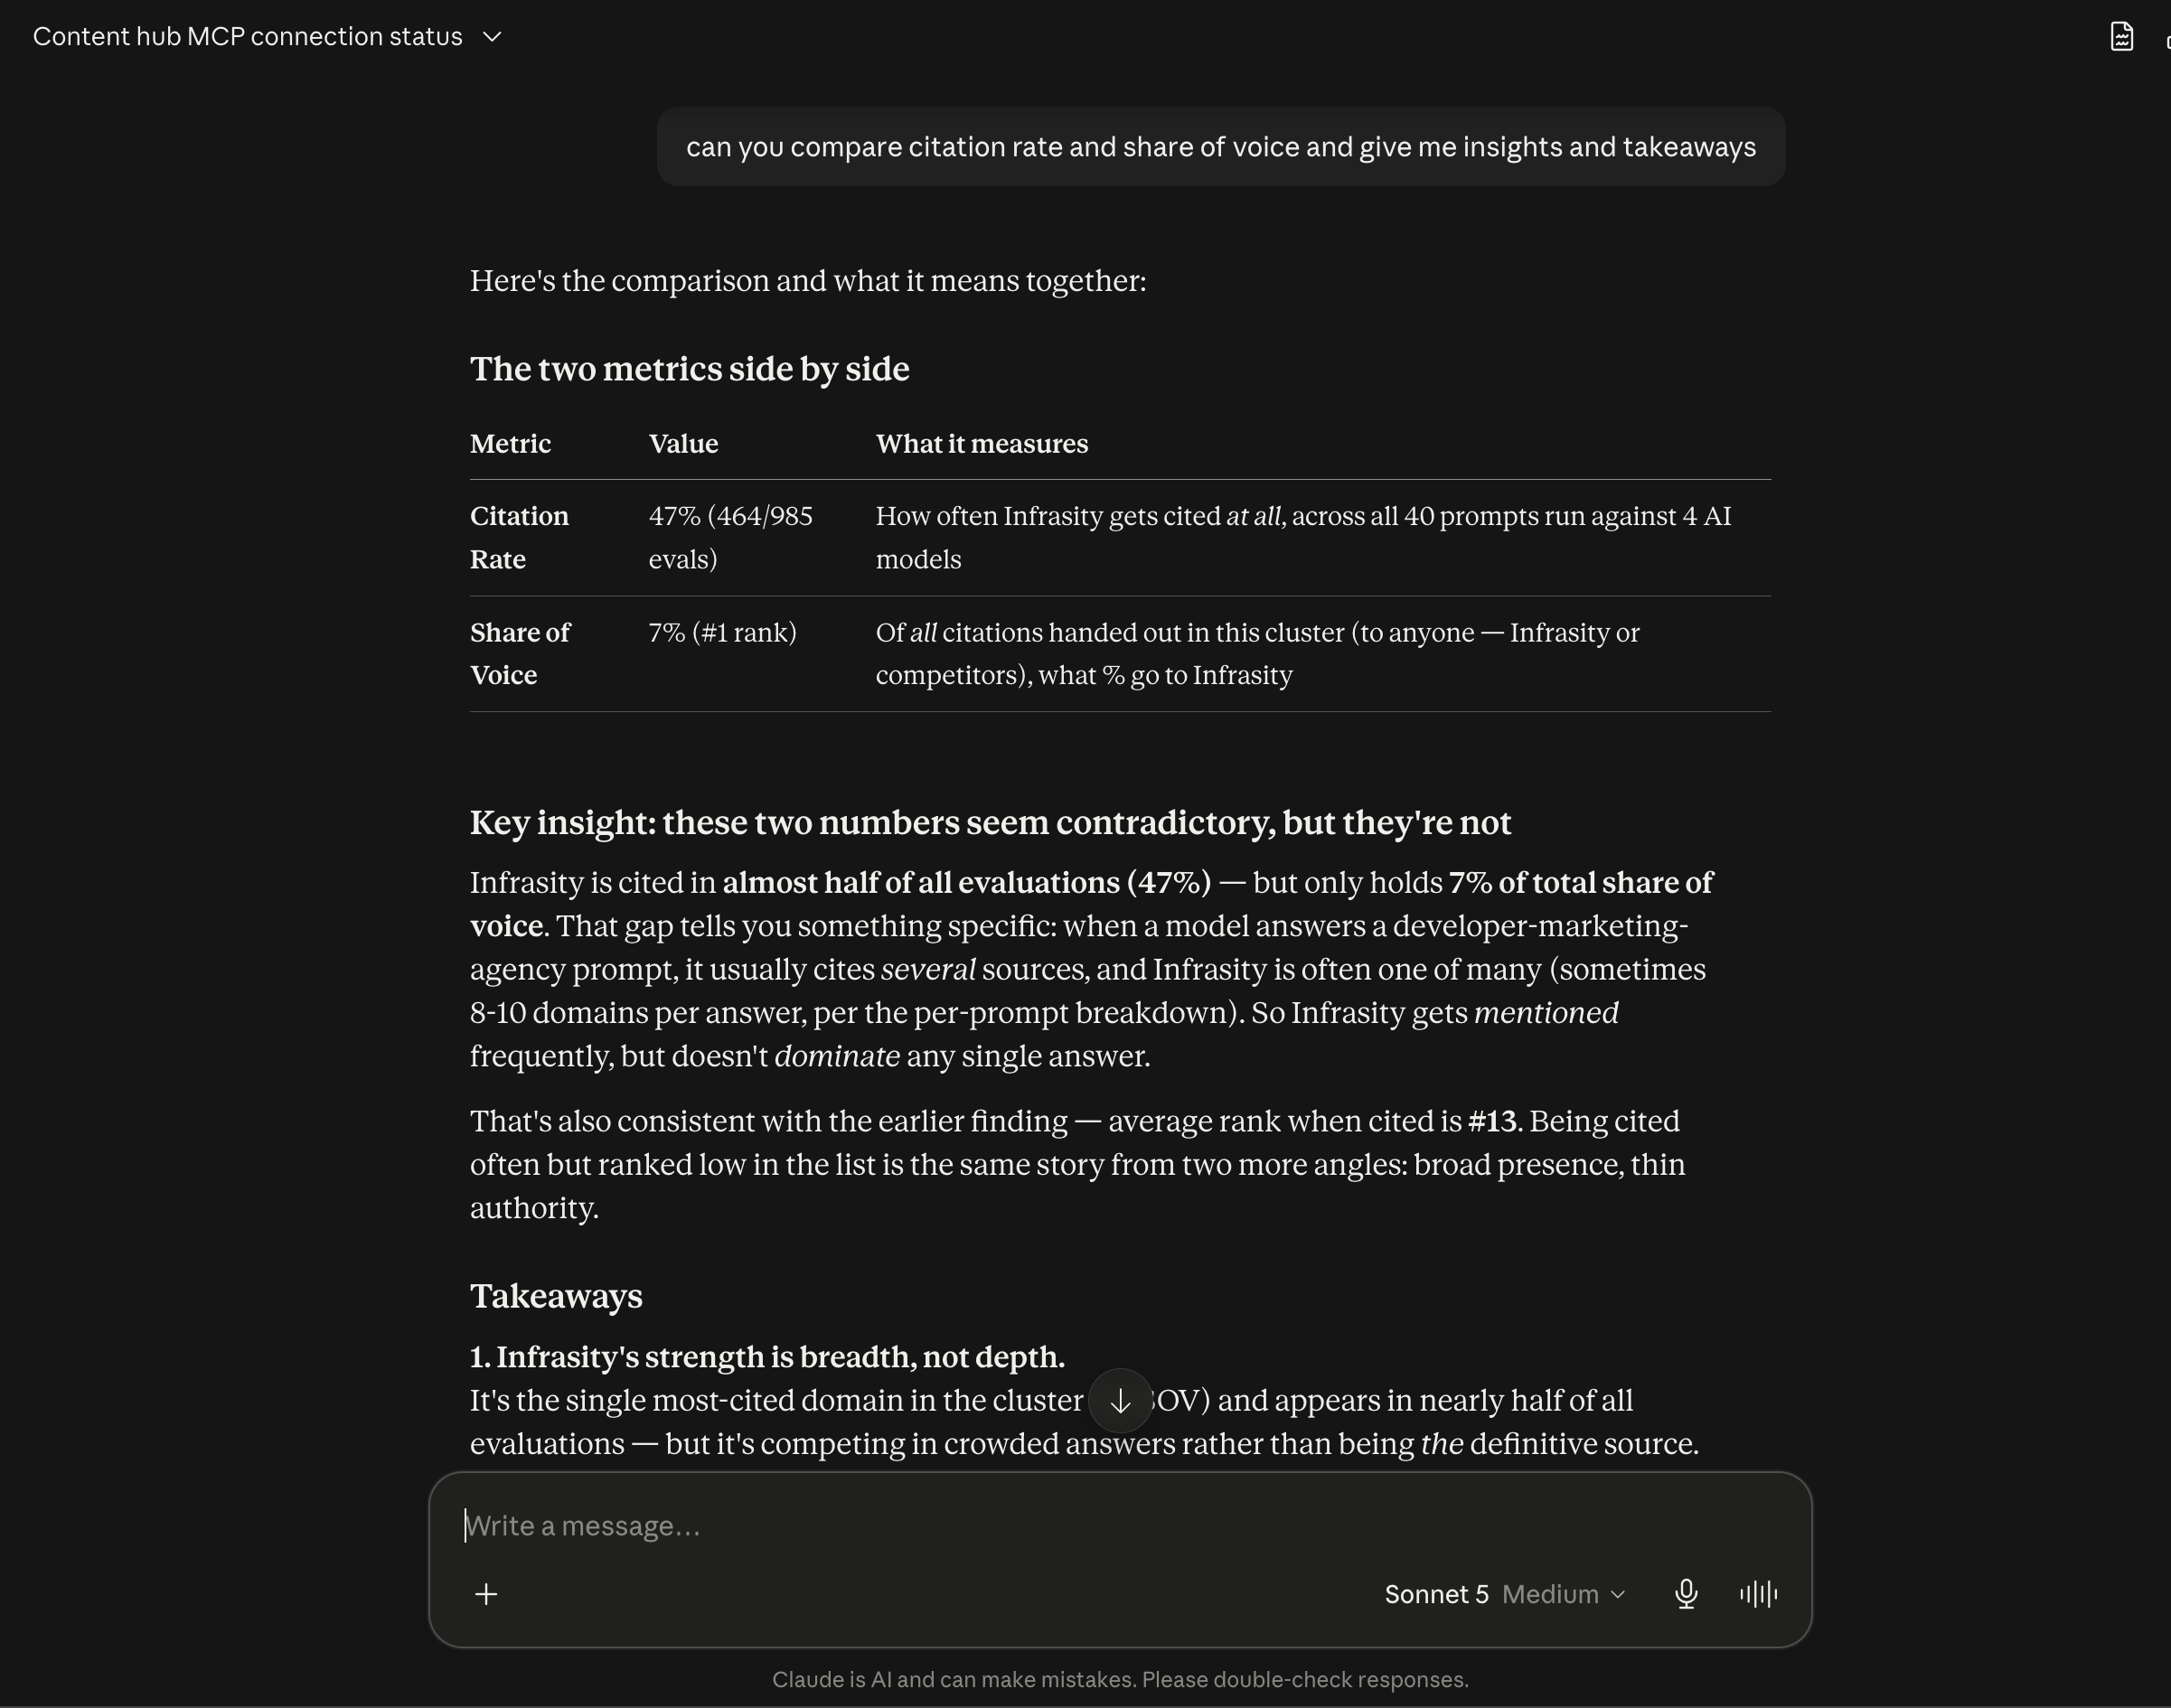
"can you compare citation rate and share of voice and give me insights and takeaways"
Claude opens with a clean side-by-side comparison, then resolves the apparent contradiction directly: Infrasity is cited in nearly half of all evaluations but only holds 7% of total share of voice, because most answers cite several sources at once (sometimes 8 to 10 domains), so Infrasity gets mentioned often without dominating any single answer. That's the same story as the rank-13 average from a different angle: broad presence, thin authority.
It closes with takeaways: the strength is breadth, not depth; the citation-rate collapse is the most urgent issue since it threatens the share of voice lead too; fixing rank position is the highest-leverage move since Infrasity is already cited often; and closing even a few of the zero-citation gaps would lift both metrics at once.
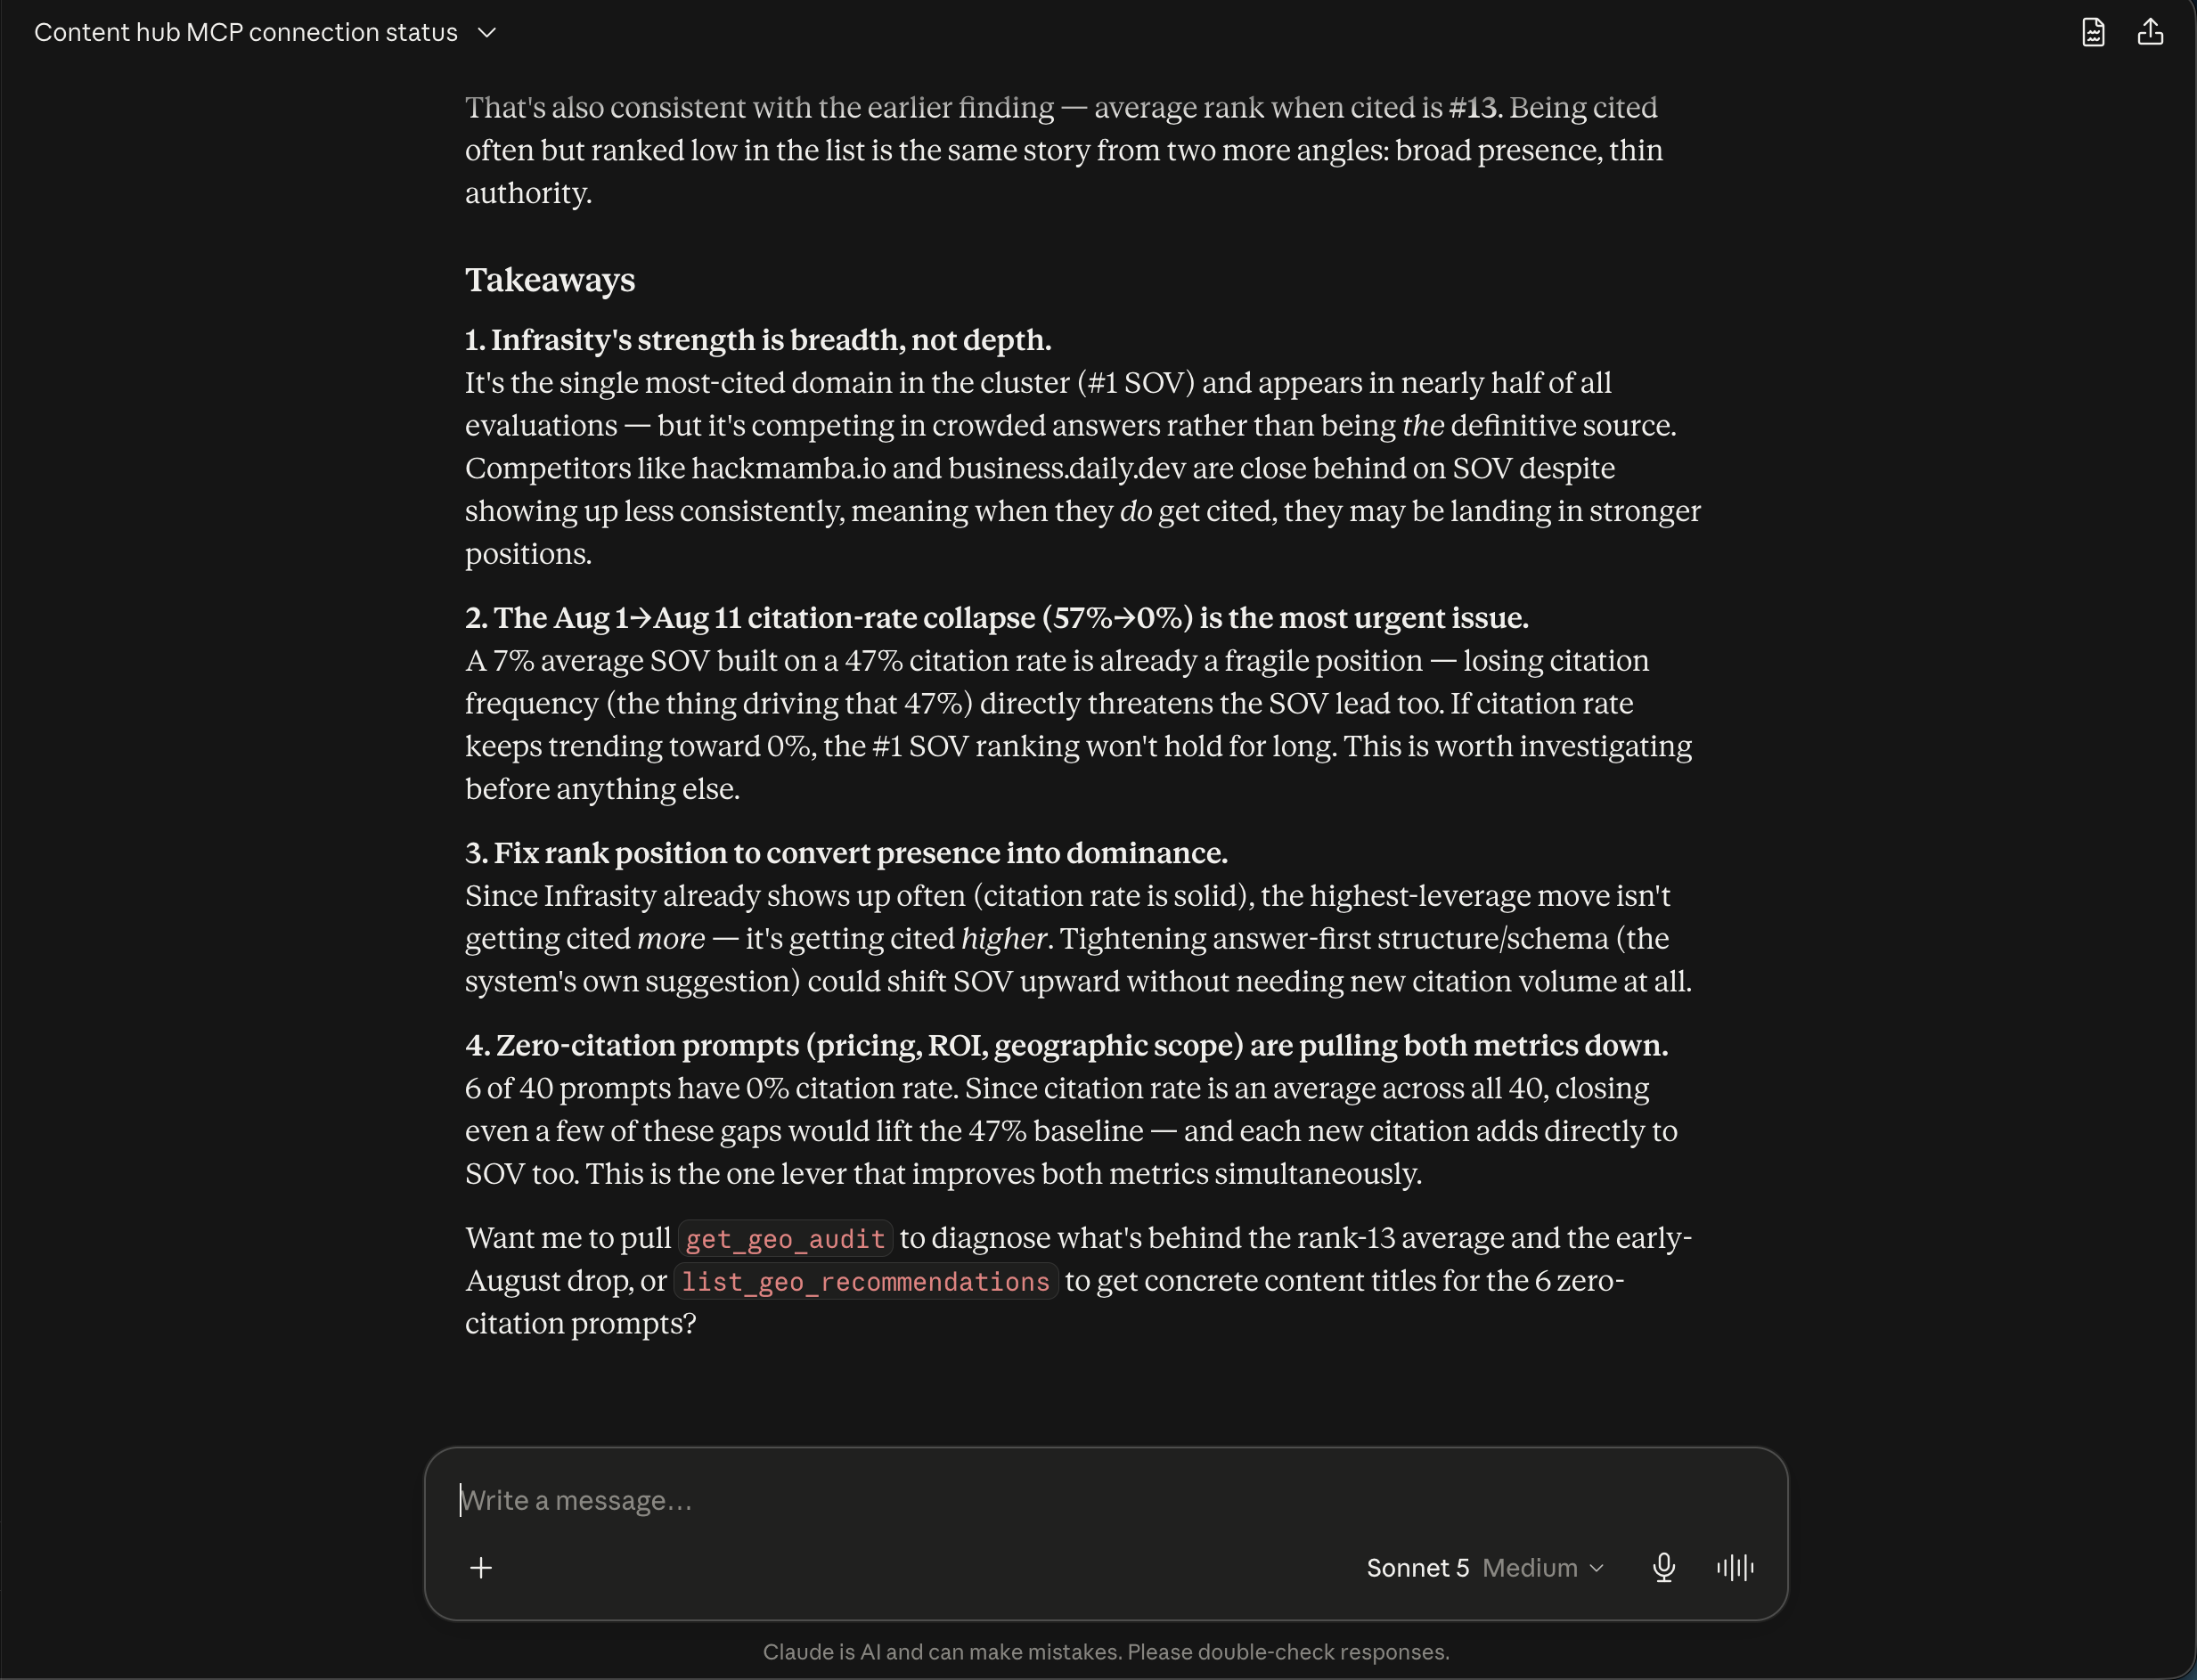
What started as a single cluster overview ends as a side-by-side comparison with real takeaways, all inside one Claude Desktop conversation, no dashboard cross-referencing required.
Log into app.infrasity.com and pull up your own GEO dashboard to see whether your citation rate and share of voice tell the same story, or a different one.
How to Track AI Share of Voice Across LLMs Using Content Hub MCP
Pull AI share of voice data for any GEO cluster straight into a Claude Desktop chat, then have Claude turn it into a prioritized content plan.
How to Run GEO/AEO Audits Using Content Hub MCP
Run a full GEO/AEO audit from a single chat message, on your own domain, a single page, or any company's docs, all over Content Hub MCP.