How to Read Your GEO AI Visibility Overview Using Content Hub MCP
Retrieve the cross-cluster AI visibility overview for your organization over Content Hub MCP, then read the KPIs, cluster statuses, what moved since the last scan, and the ranked next actions.
The GEO overview is the one page that answers a single question: how visible is your brand in AI answers right now, across every cluster? It combines your citation rate, share of voice, and average position with a list of the prompts that moved and a ranked list of what to do next. When Claude Desktop is connected to Infrasity's Content Hub over MCP, you can retrieve the same overview in one message and ask Claude to interpret it.
Before you start, confirm the following:
- Claude Desktop is connected to Content Hub over MCP. See the Content Hub MCP setup guide.
- Your organization has at least one GEO cluster with prompts and several completed runs. Deltas and the "what moved" lists need two scans of the same cluster to compare.
Fetch the overview
Request the GEO AI visibility overview for the Infrasity organization over the last 30 days.
Claude calls the overview tool and returns the headline numbers first. The default window is 30 days. You can also ask for 7 or 90 days, a custom date range, one cluster, or specific engines. Each change to the window recalculates every number below.
For Infrasity, the result is 612 AI answers checked across 4 active clusters and 4 engines. The KPI table reads as follows:
- Citation rate is the share of AI answers that cite you: 64%, up 9 points on the previous 30 days.
- Share of voice is your share of all citations across competing domains: 24%, ranking #1 of 47 domains.
- Avg position is the average of the best rank in each answer: #1.8, with the best at #1. Lower is better.
- Prompts moving up and dropped count the prompts that gained or lost rank since the previous scan: 21 up, 2 down.
Read the clusters and top domains
The cluster table gives each cluster a status based on its citation rate:
- Leading at 40% or higher.
- Growing at 15% or higher.
- Needs setup when a cluster has no prompts yet or is switched off.
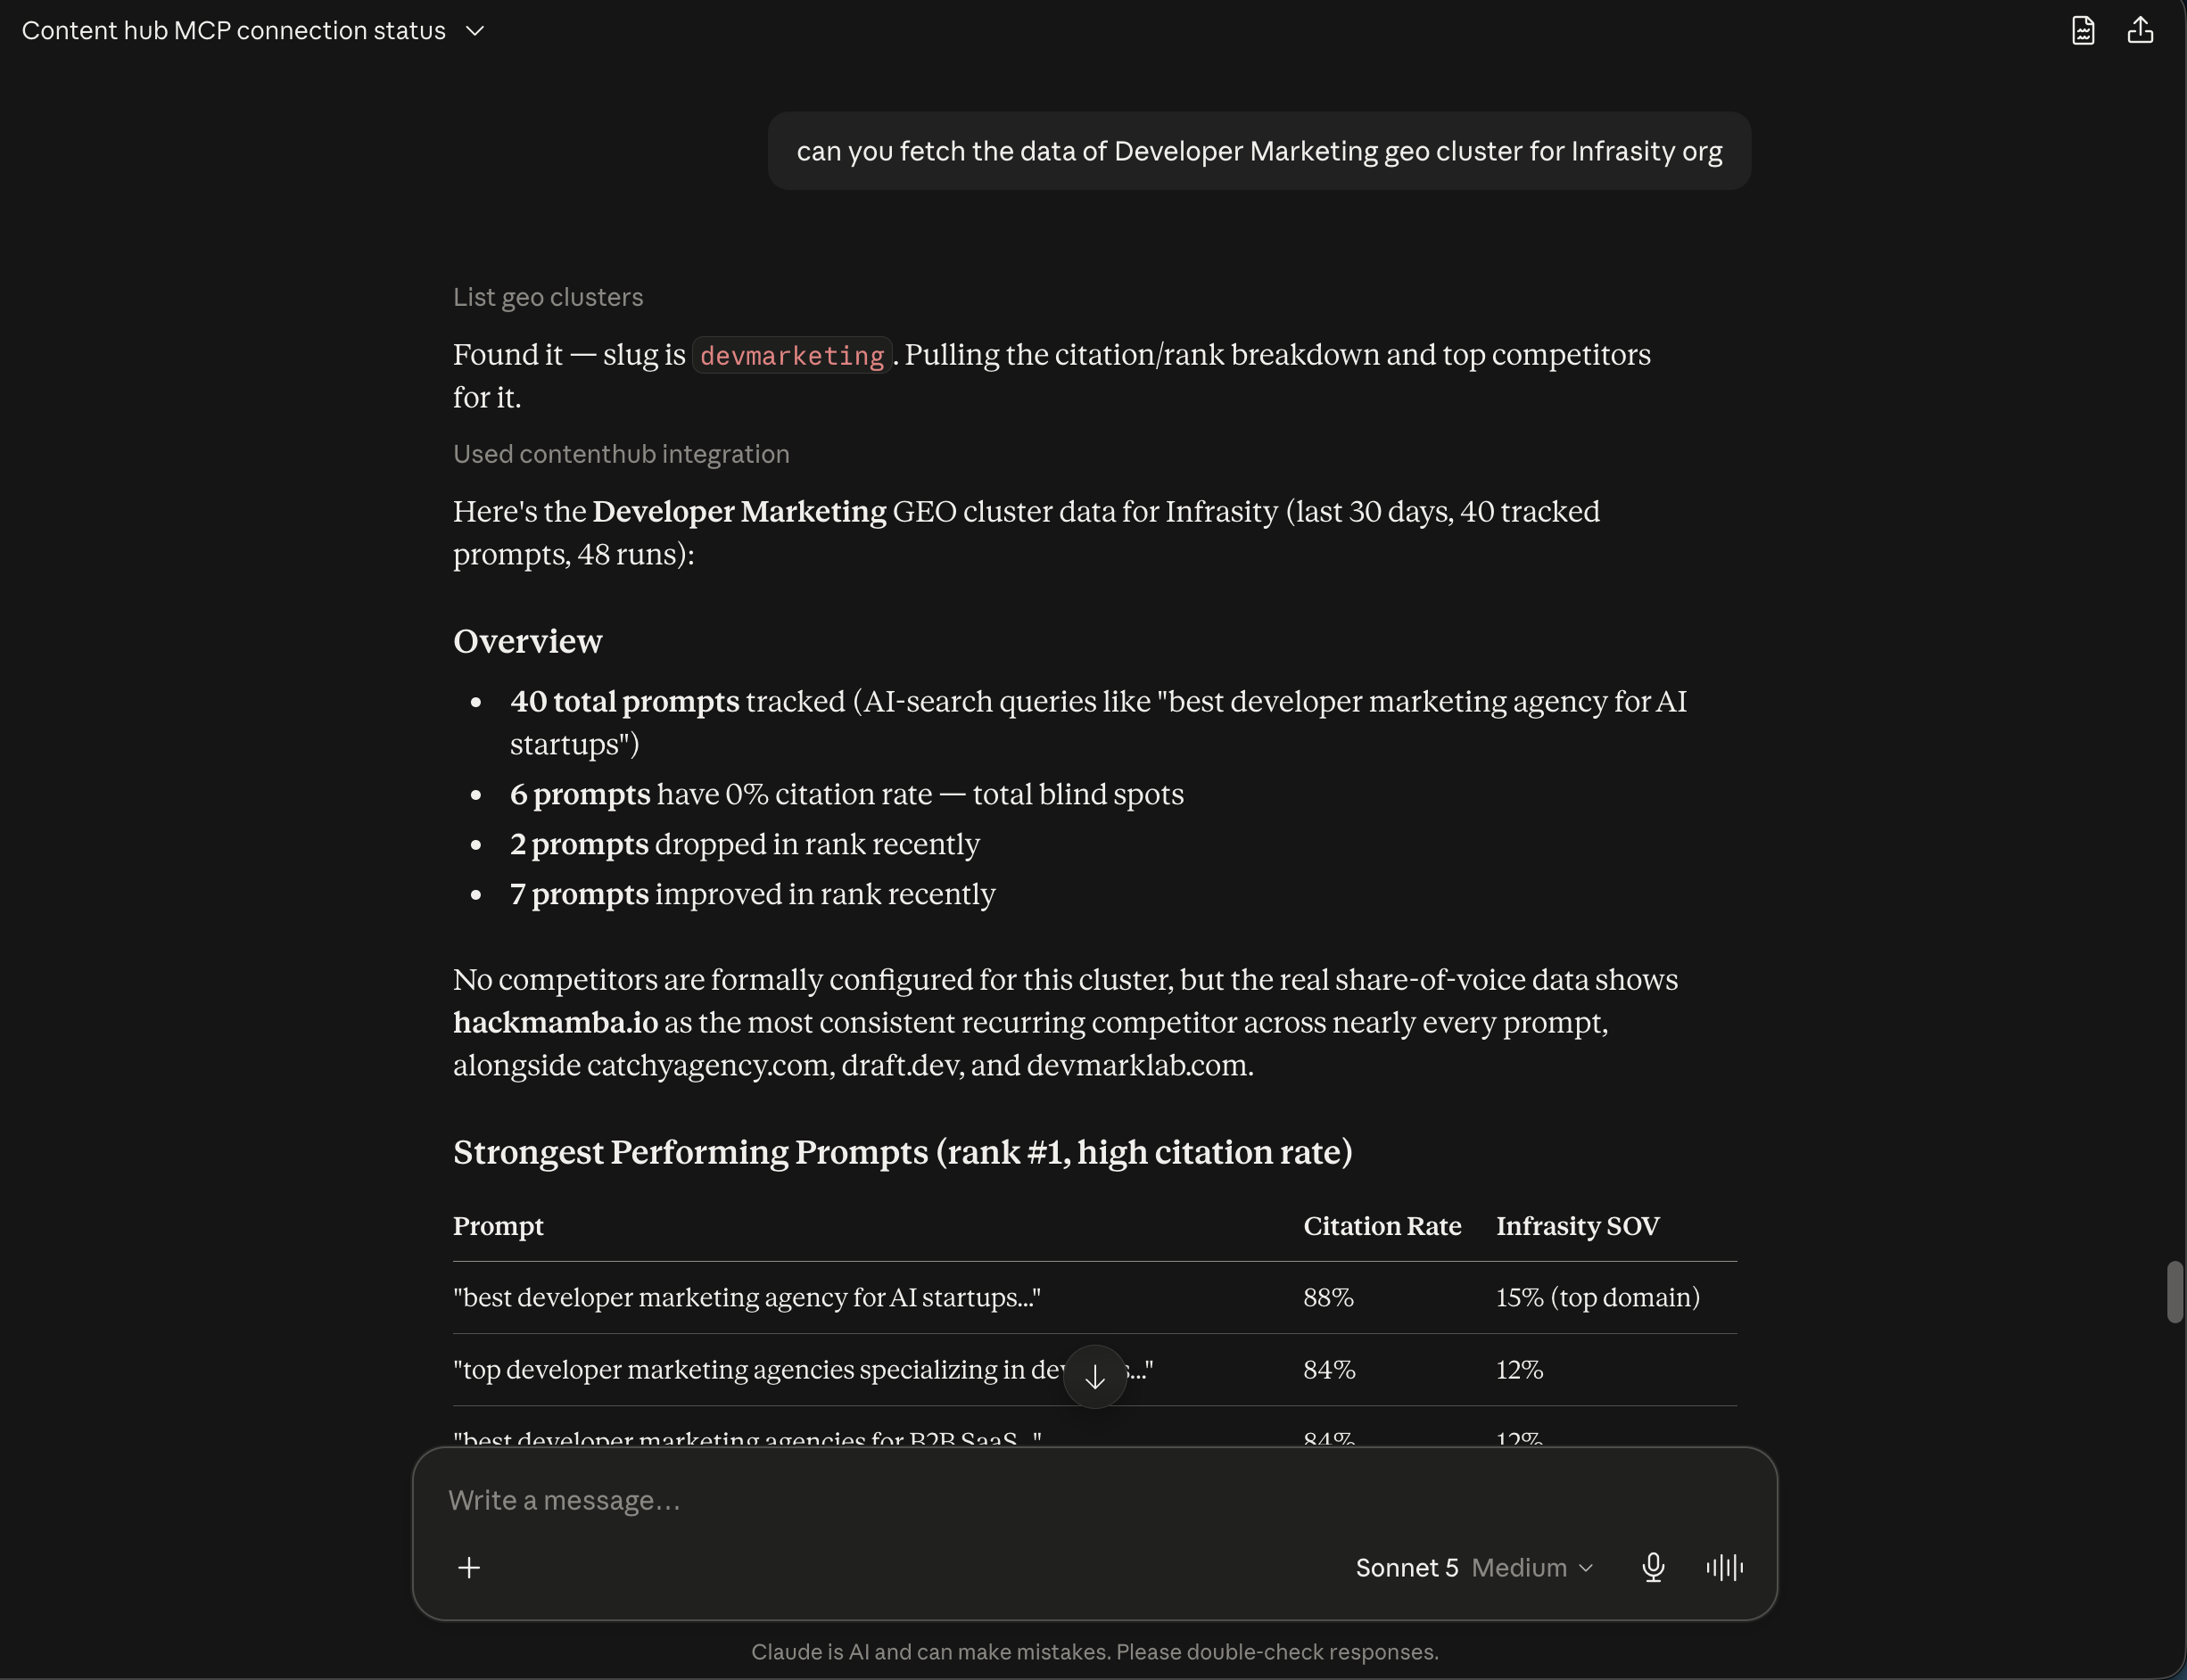
All four of Infrasity's active clusters are Leading: Developer Marketing at 78%, AI Search Optimization at 64%, GitHub Marketing at 51%, and Content Marketing Agencies at 46%. Each is up on the previous period, and Infrasity ranks #1 in share of voice in three of the four. Developer Events is a new cluster with no prompts yet, so it does not count toward any number.
Below the table, Claude lists the top cited domains with their type. Infrasity is first at 24%, with the nearest domain, draft.dev, at 11%.
See what moved since the last scan
The overview compares each cluster's latest scan with the one before it and sorts the changes into three groups:
- Gained. 21 prompts improved. "top developer marketing agencies specializing in devtools" went from #3 to #1, "how to market an open source project" went from #5 to #1, and two prompts that were uncited now rank.
- Dropped. 2 prompts slipped one place, both from #1 to #2, and both still rank.
- Never cited. 3 prompts have 0 citations across at least 3 answers. All three are pricing and cost queries, a lane where no single source dominates yet.
Follow the ranked actions
The overview ends with up to five actions, ordered by type and then by the number of prompts they affect. The order is data fixes first, then setup, then content briefs, then distribution.
For Infrasity, the list reads:
- Content brief. Publish a pricing and cost guide for developer marketing, covering 3 prompts.
- Distribution. Get listed on clutch.co and dev.to, the most-cited non-competitor sources in your clusters.
- Setup. Add prompts to Developer Events so the new cluster starts tracking.
Request takeaways
Request takeaways on the overview.
Claude returns four findings that are easier to see when the numbers are read together:
- Infrasity leads its category. A 64% citation rate and a 24% share of voice put it #1 of 47 domains, 13 points ahead of the next domain.
- Every active cluster is Leading. AI Search Optimization improved the most, by 12 points.
- Momentum is clearly positive. 21 prompts moved up against 2 that moved down, and both slips are #1 to #2.
- Pricing is the clearest next win. Three pricing and cost prompts are an open lane, with no single source dominating yet, and a guide plus two listings targets them.
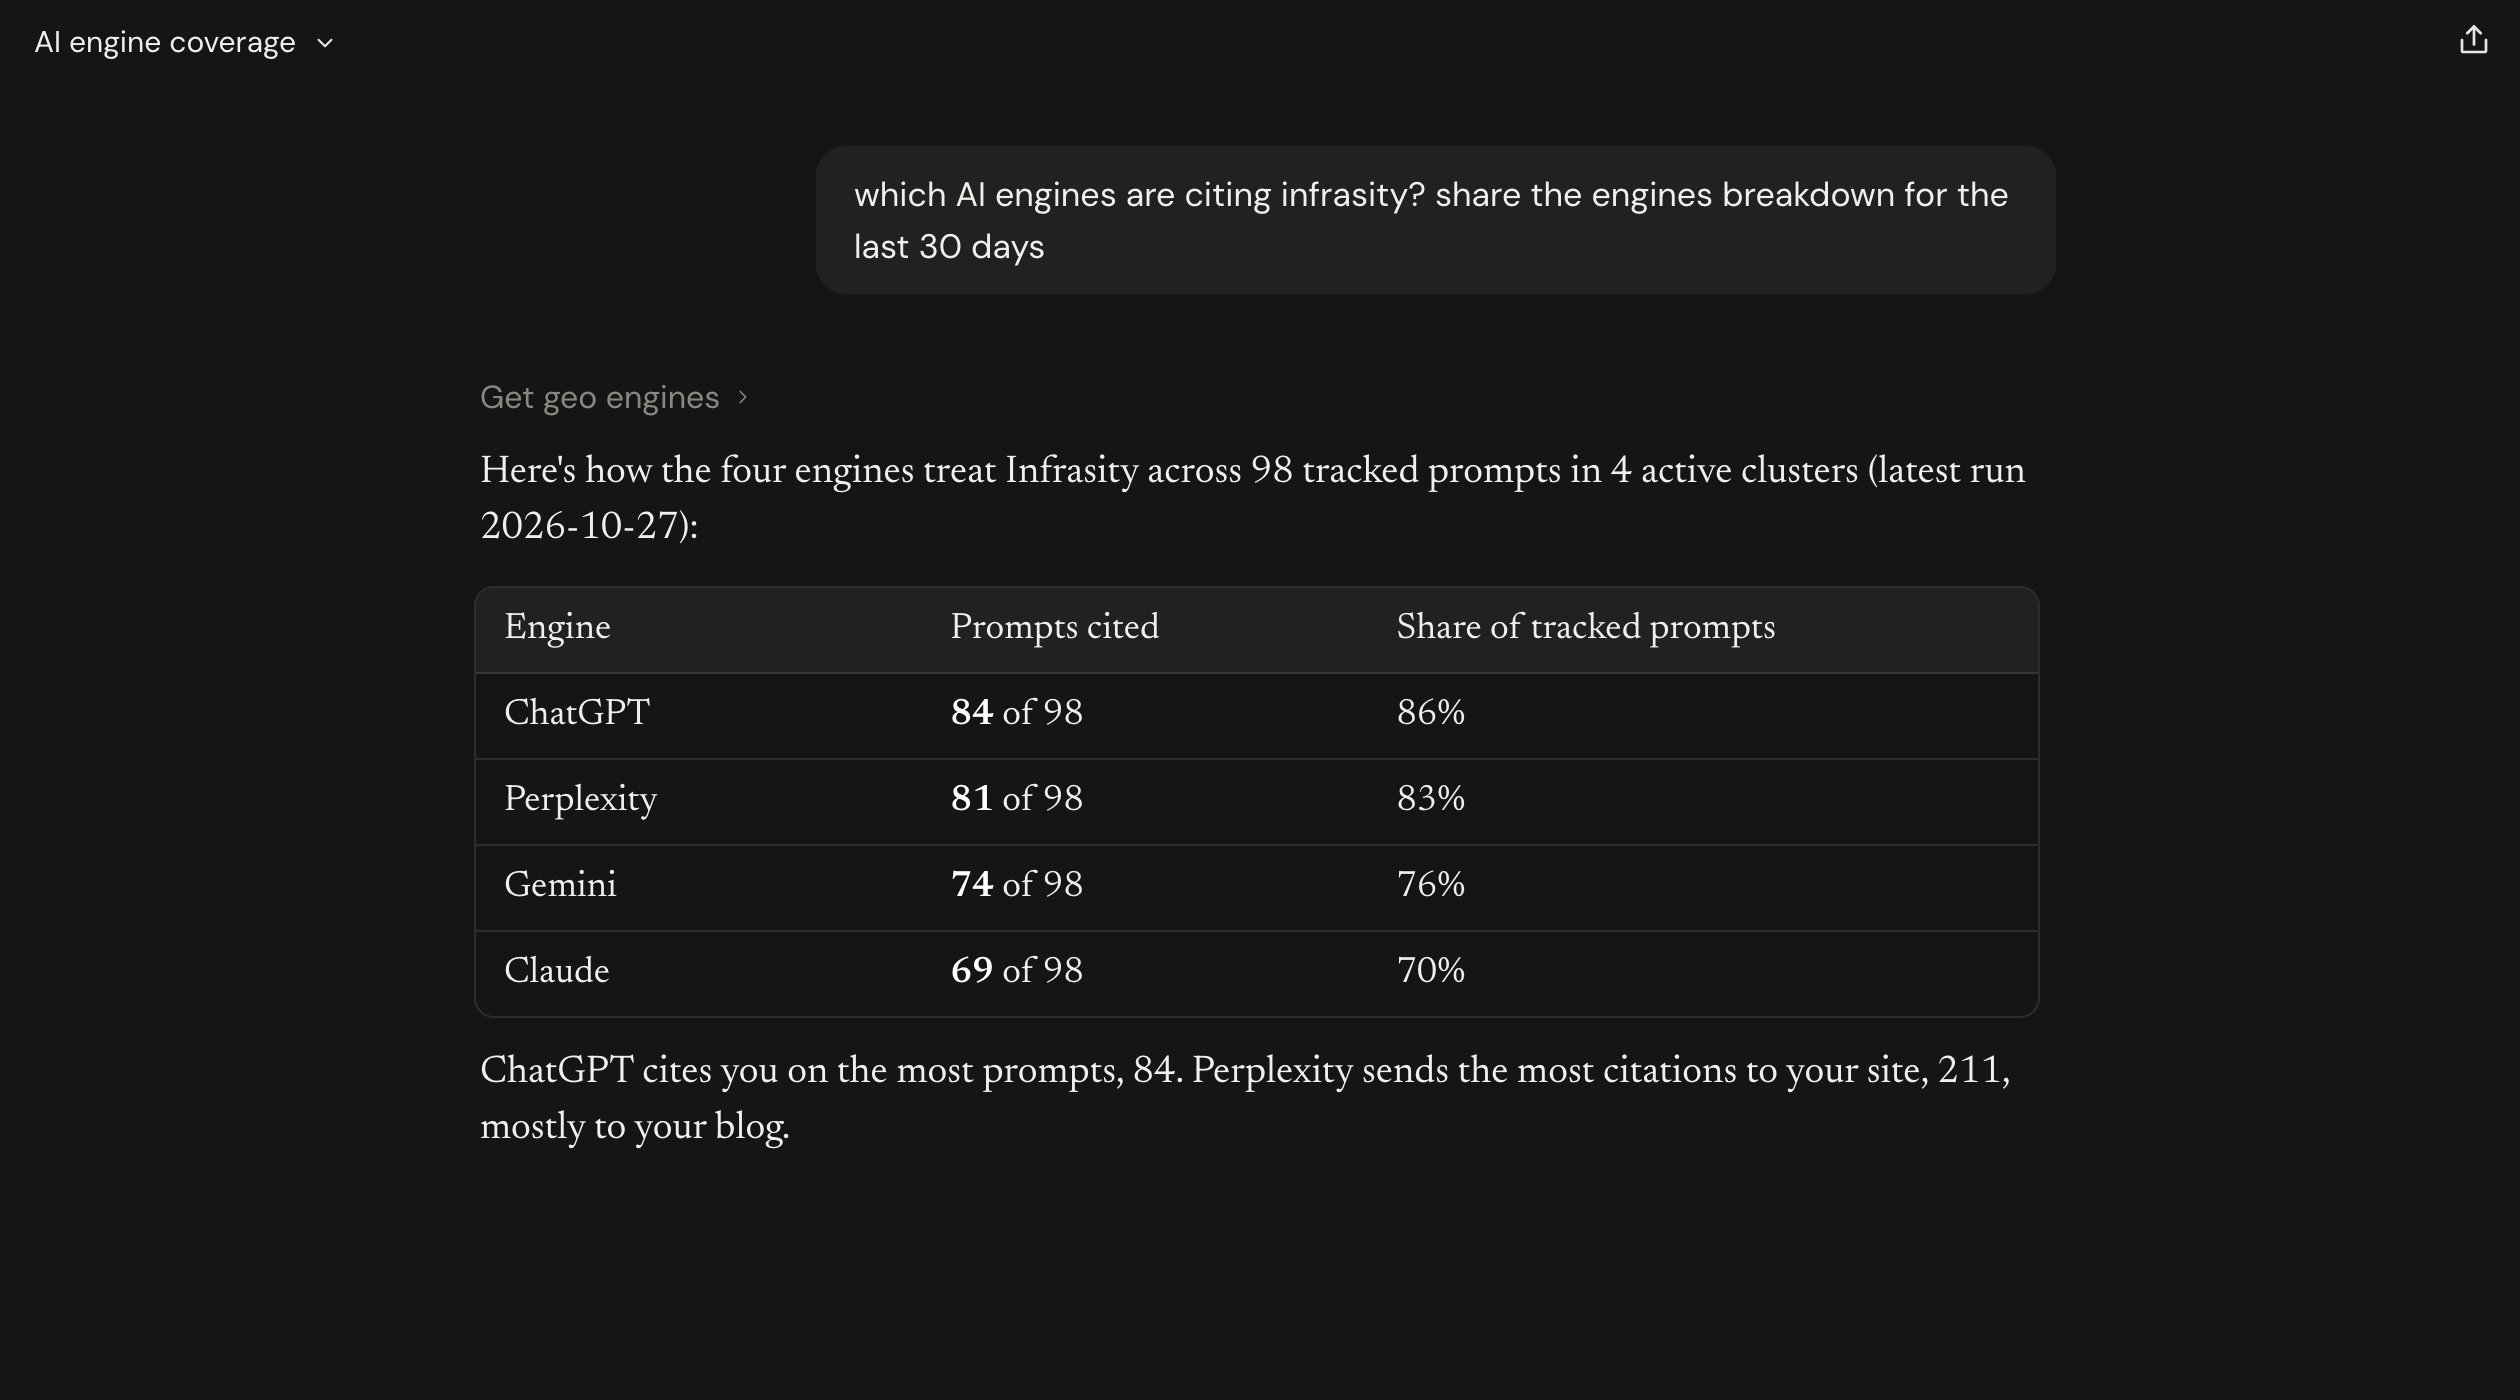
Claude then offers to break the numbers down by engine.
Run the overview at the start of each week. The "what moved" lists compare against the previous scan, so a weekly check shows which wins are holding and which prompts are ready for the next push.
Open app.infrasity.com and retrieve the overview for your own organization to see which clusters lead and which prompts moved.