How to Check Published Blog Performance at a Glance
Pull blog performance across multiple sprints in one message over Content Hub MCP, complete with a chart, the full publish log, and Claude's takeaways.
Once Claude Desktop is connected to Infrasity's Content Hub via MCP, you don't need to open the dashboard and click through each sprint one at a time to see how your published content is doing. Ask for a range of months in one message, and Claude pulls the summary numbers, the full list of what went live, and a chart, then lets you follow up for the "so what."
Before you start, make sure:
- The sprints you want to check already exist and span the months you care about
- Their topics are published with real URLs, so there's something for GSC to track
- GSC is connected, so click and impression data can actually populate
Here's the flow.
Fetch blog performance across multiple sprints
Ask for a range of sprints by name, in one message, for example:
"for the June, July and August Sprint cycle of 2026, can you fetch and analyse the performance of published blogs for Infrasity org"
Claude pulls the sprint performance data and returns a clean summary table first: topics queued, published, publish rate, GSC clicks, and GSC impressions, one row per sprint. June queued 10 topics and published 9 (a 90% publish rate), July queued 25 and published 14 (56%), and August queued the most yet, 32, but published only 8, a 25% publish rate with 0 clicks and 0 impressions so far.
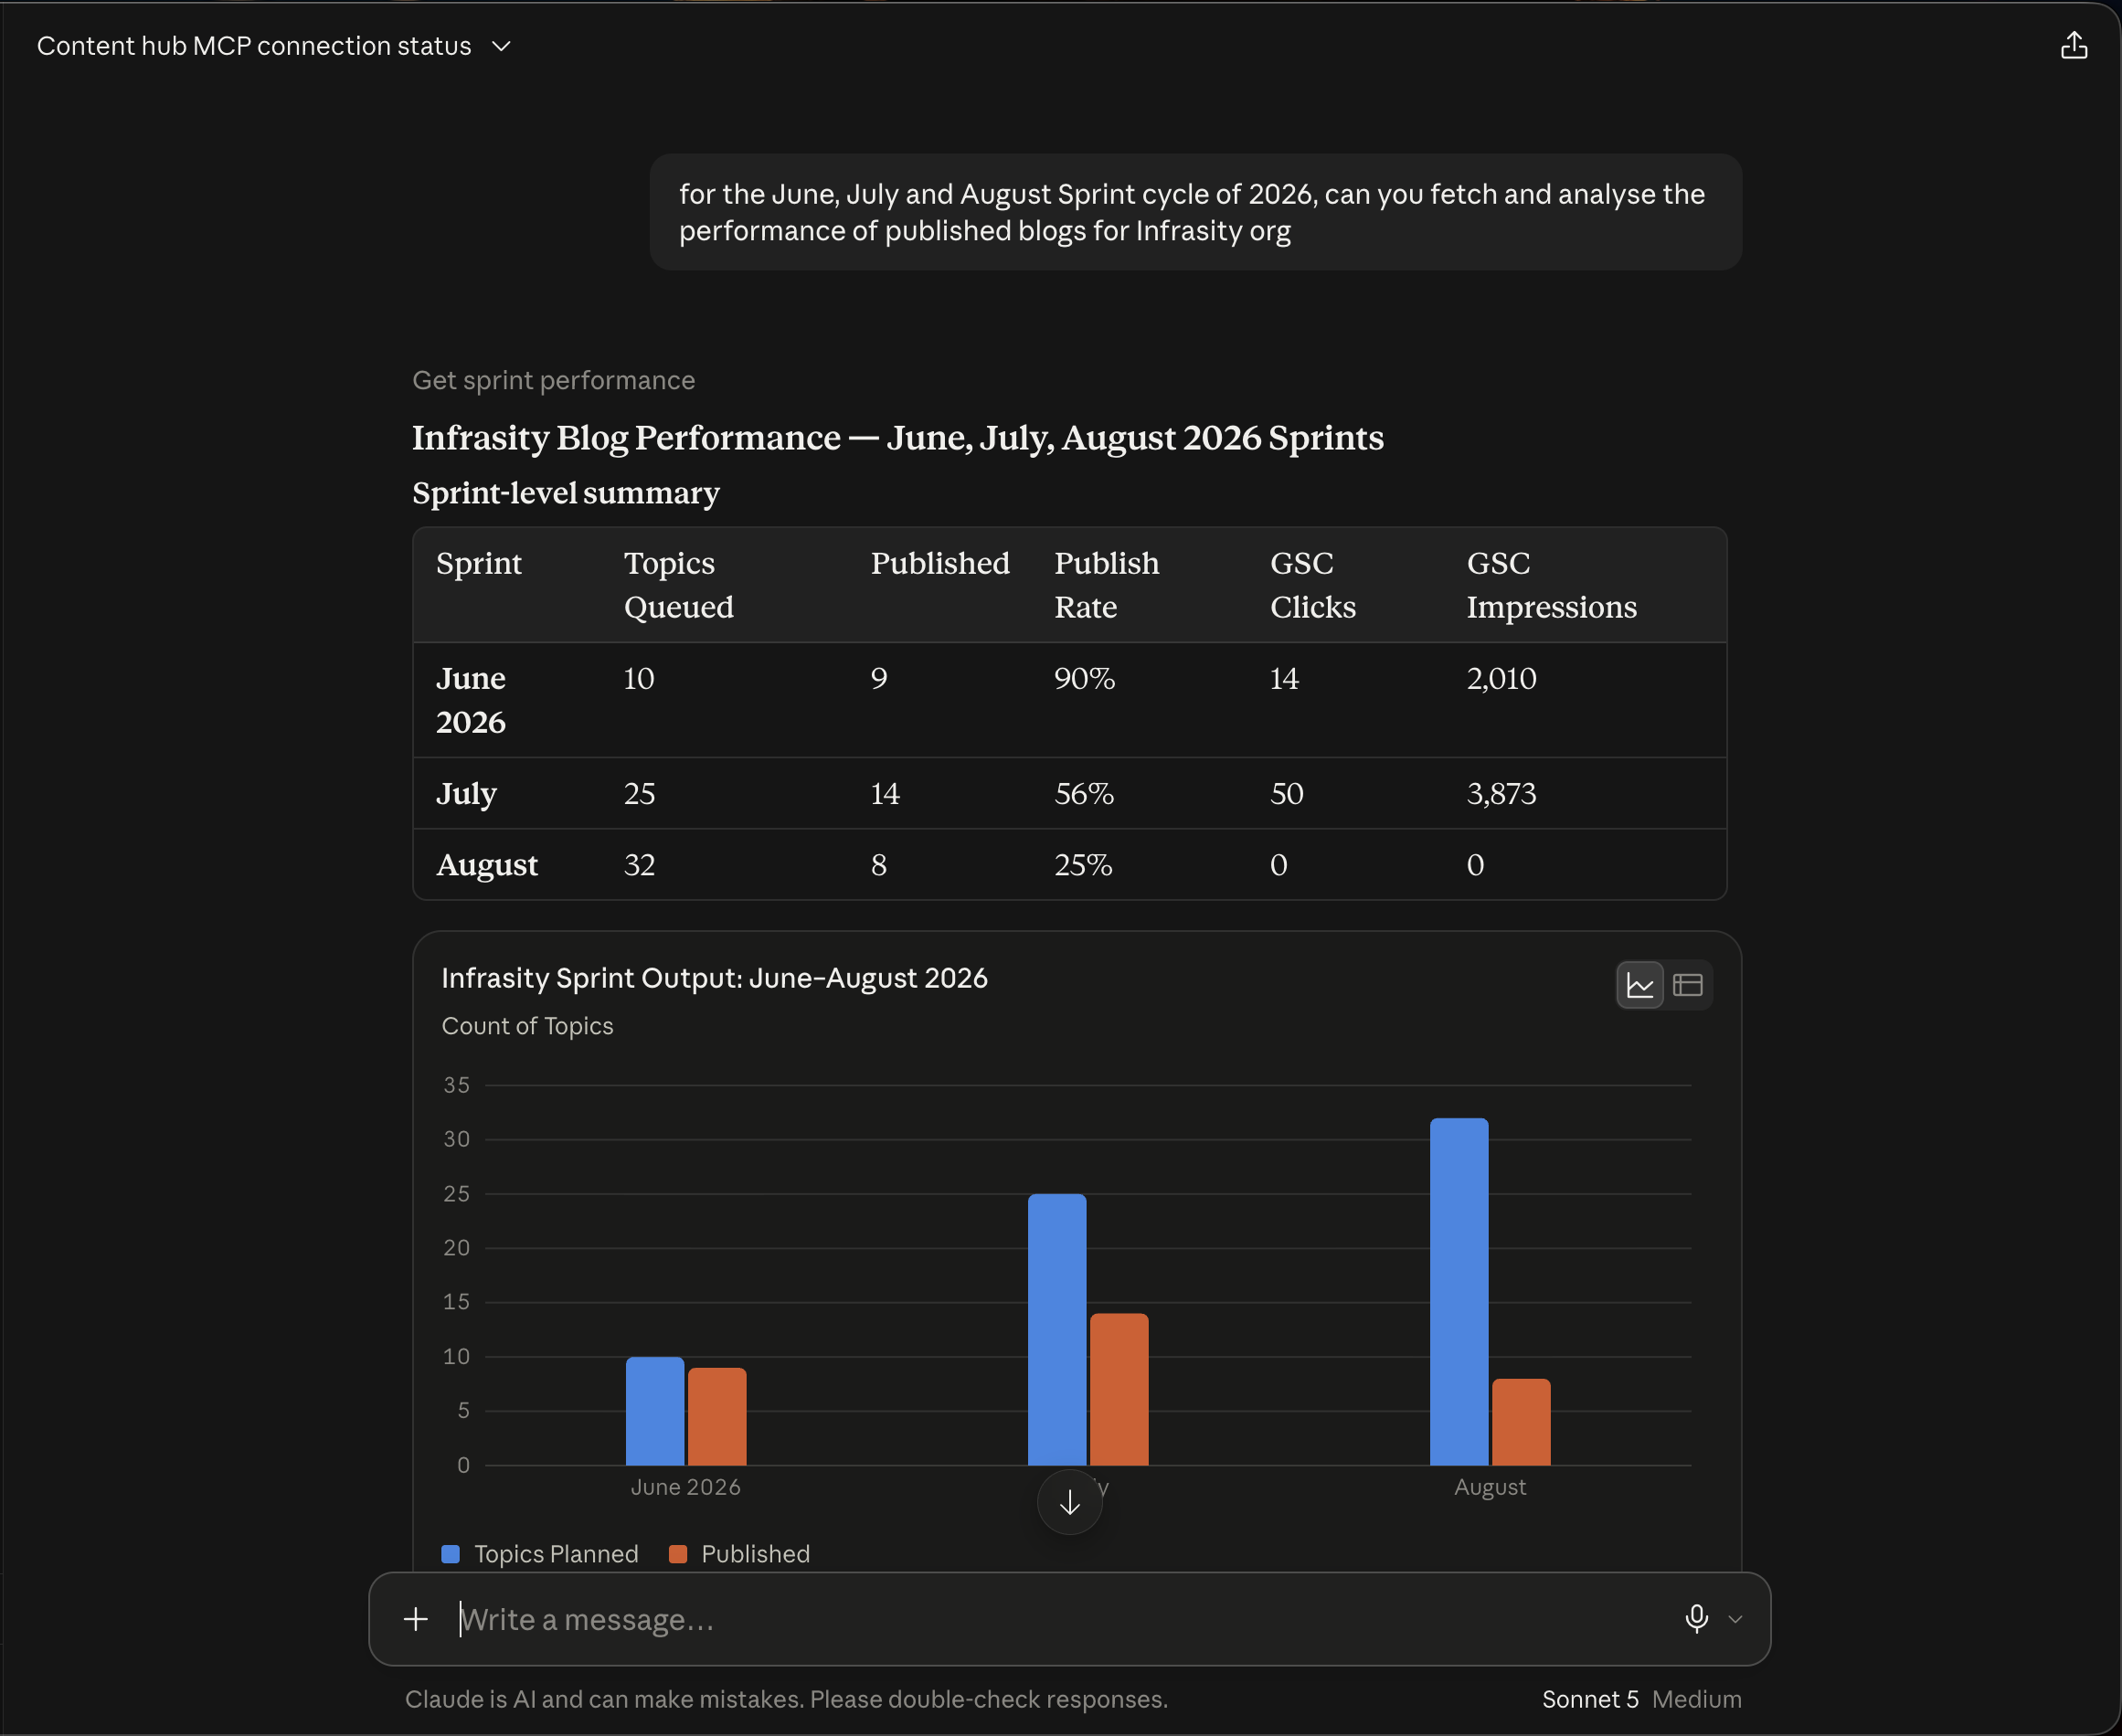
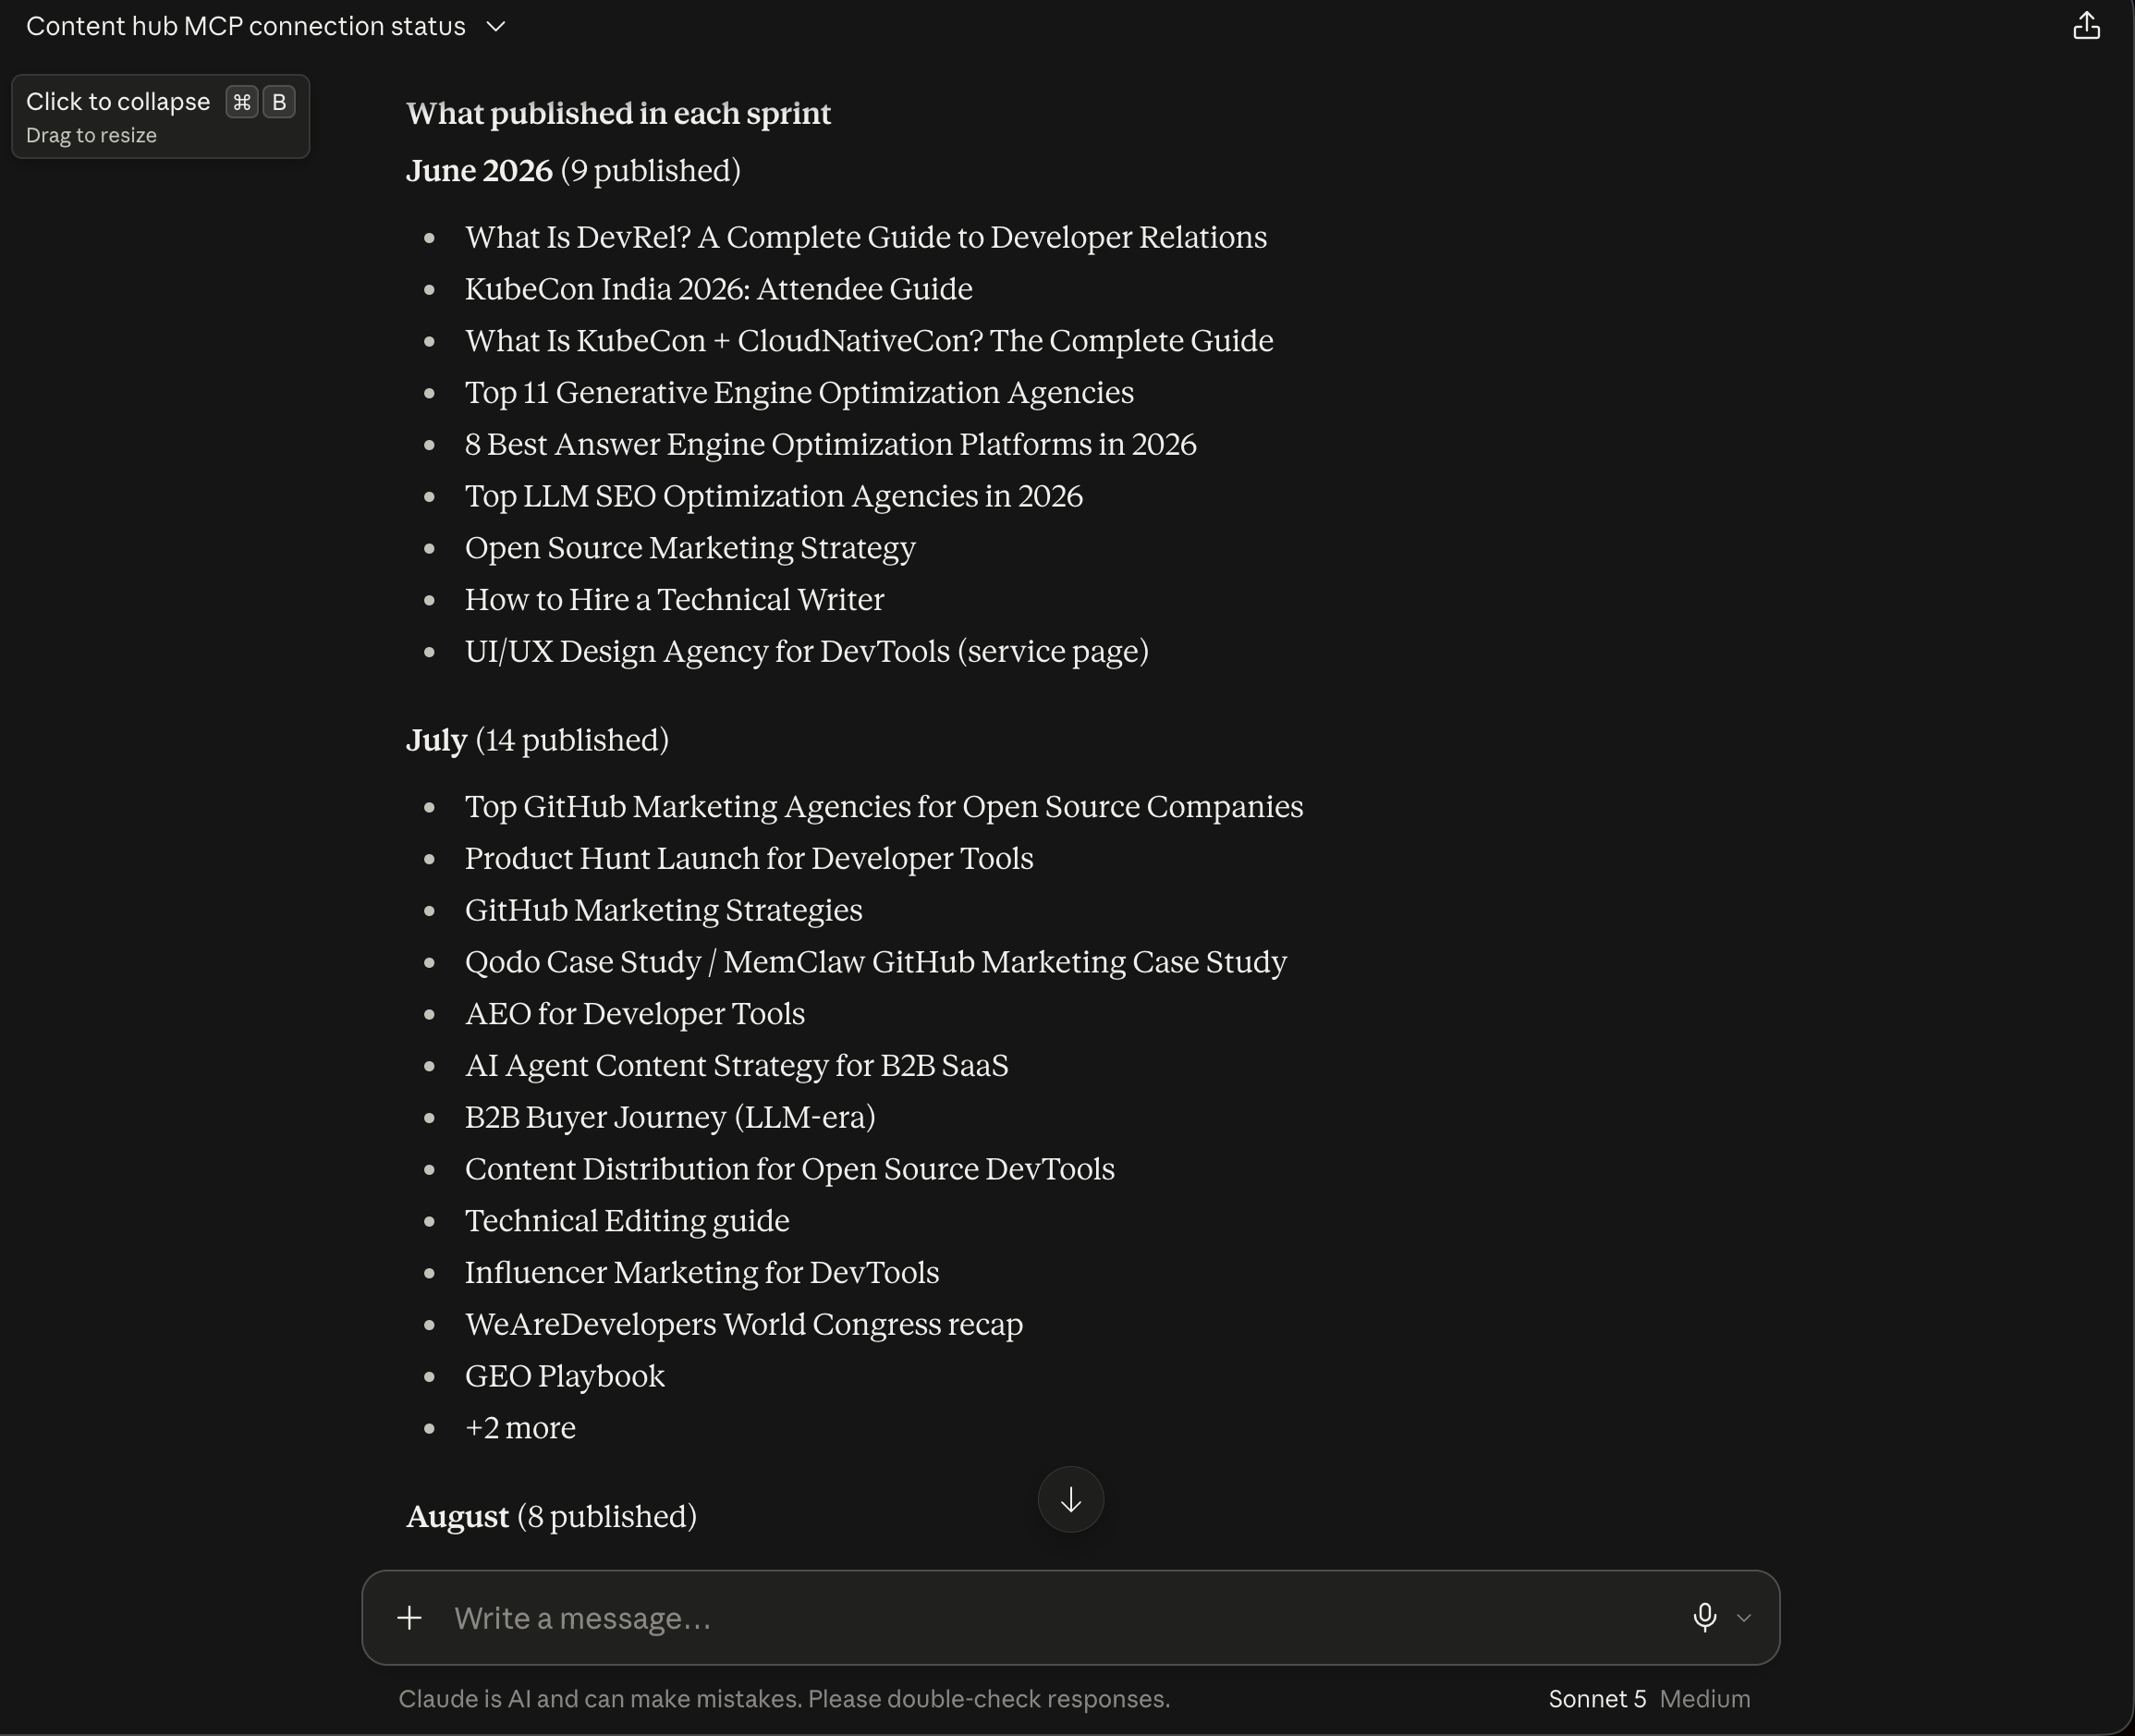
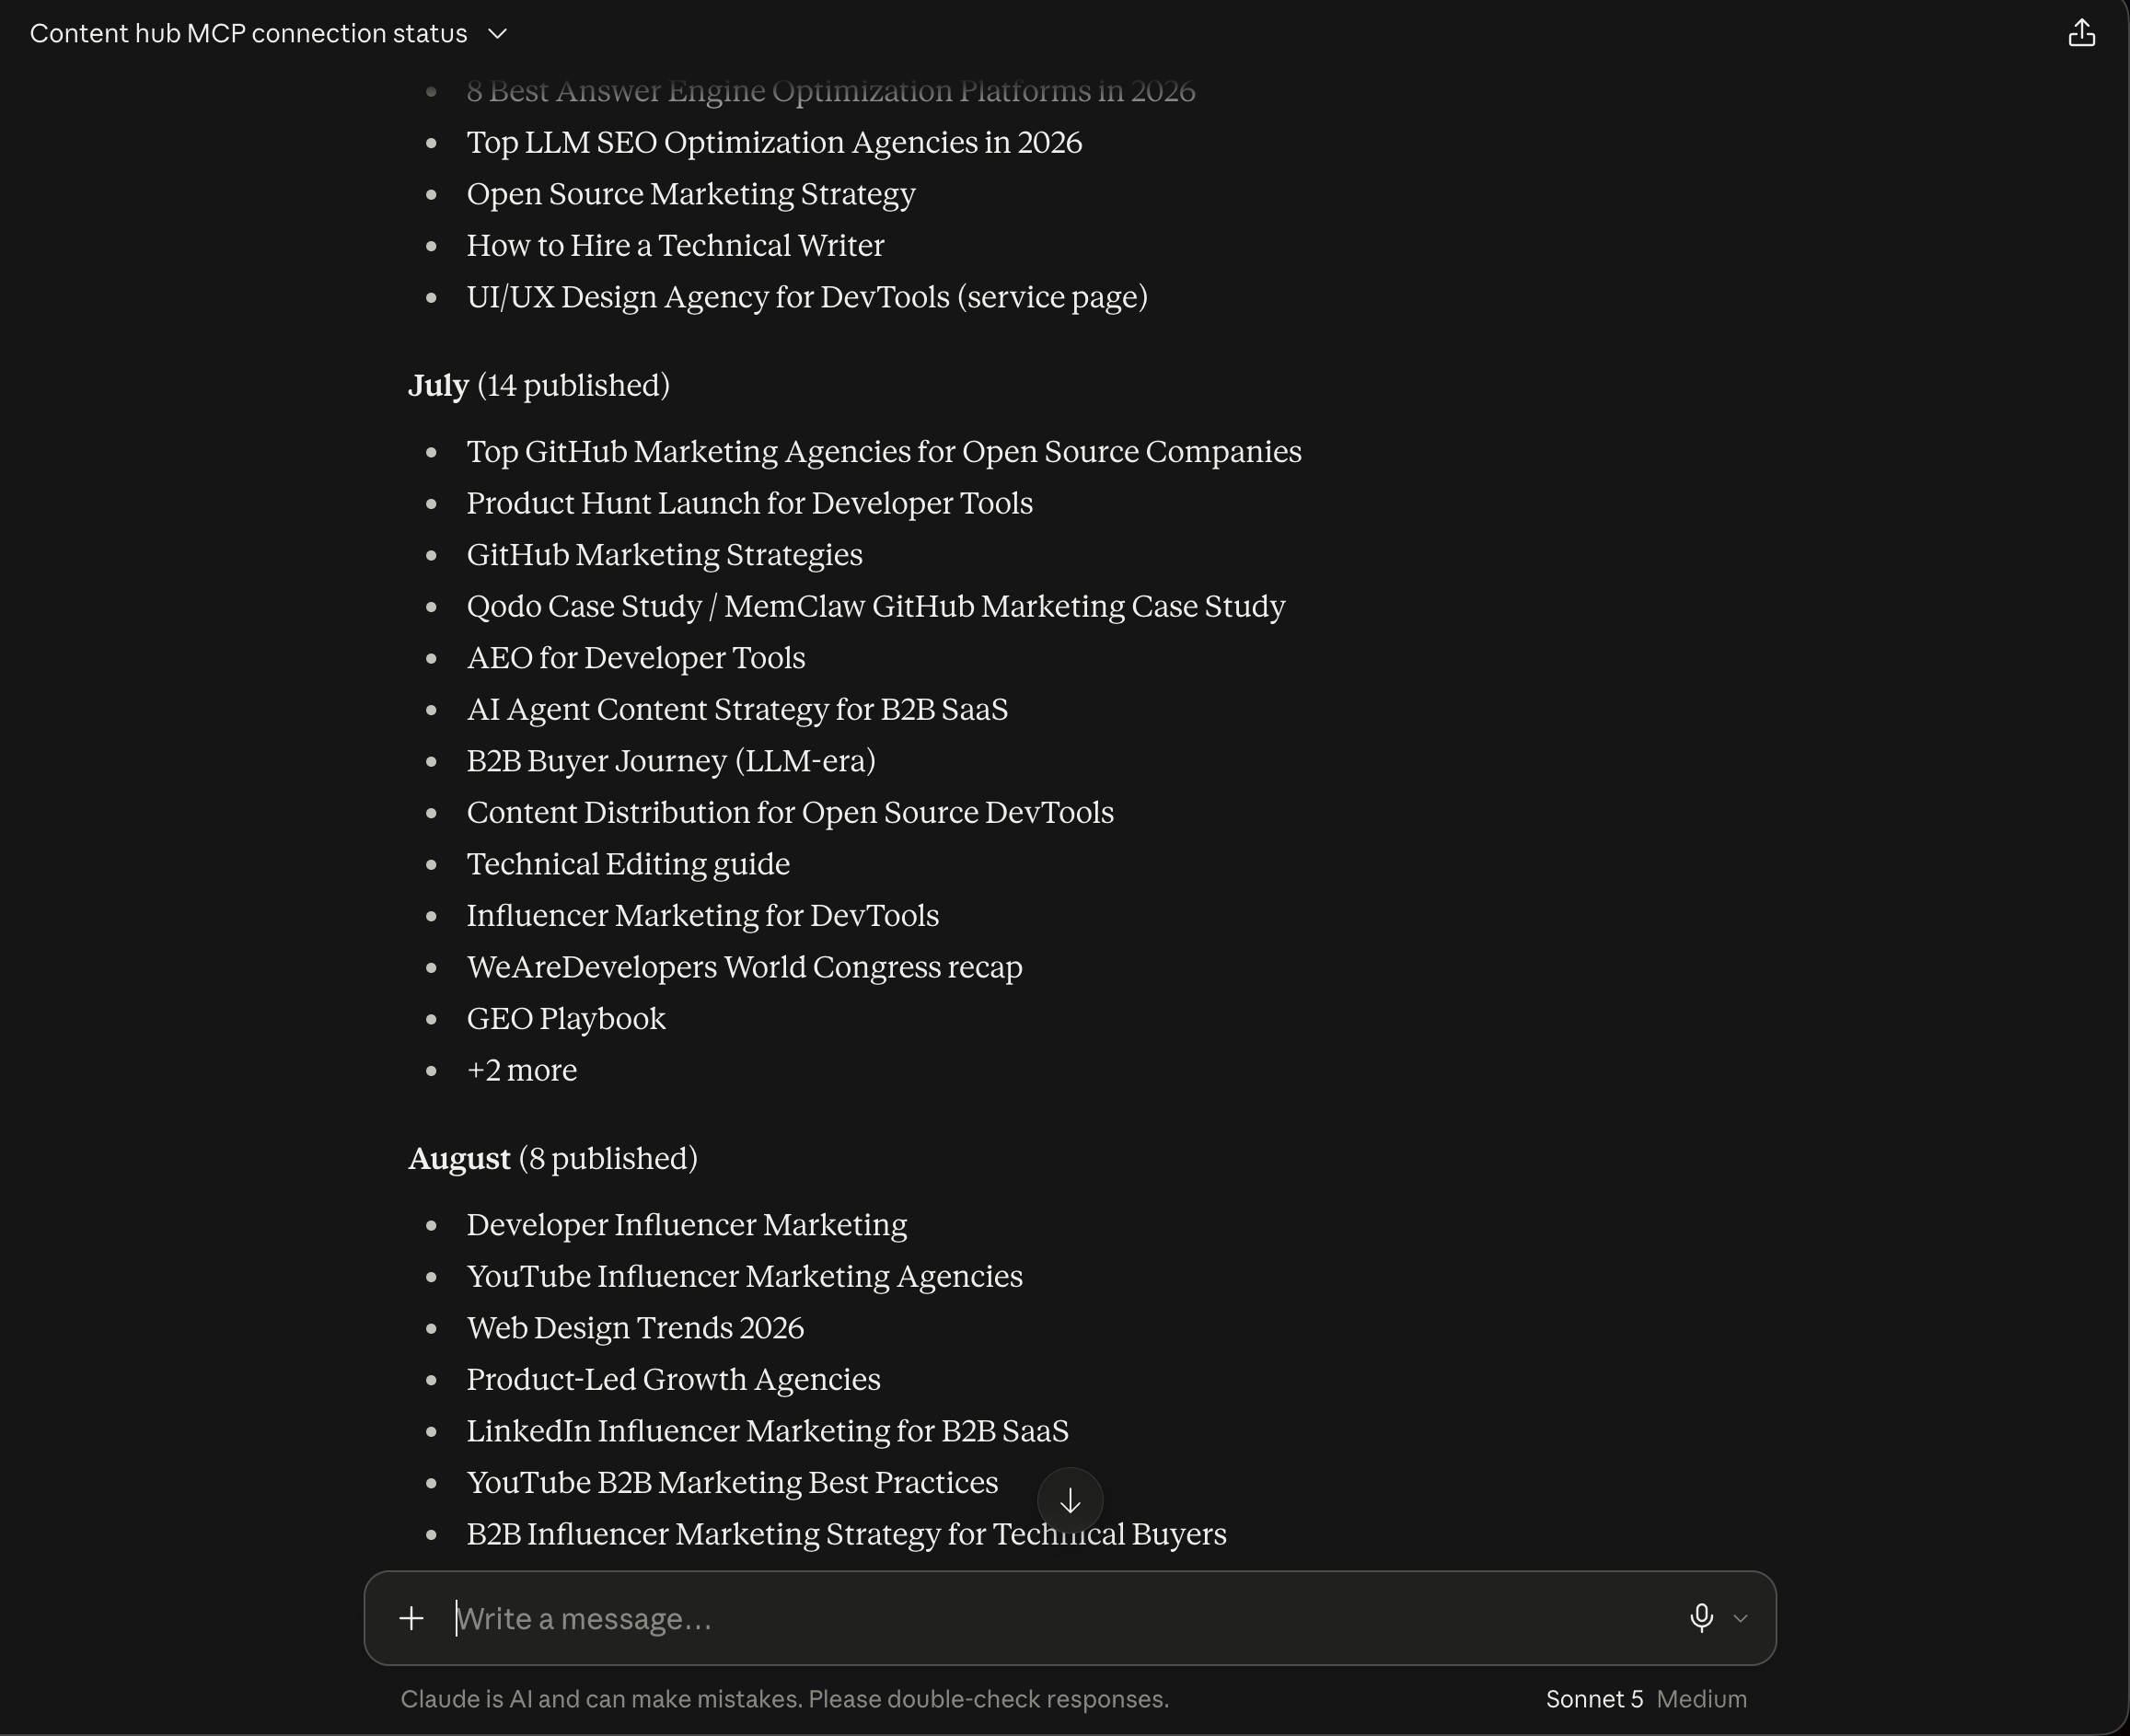
Alongside the table, Claude renders an actual bar chart plotting topics planned against topics published side by side, so the growing gap between the two is visible at a glance instead of something you have to calculate from the table yourself. It then lists what published in each sprint, every single title, broken out by month: June's 9 posts lean heavily on GEO/AEO and conference content ("Top 11 Generative Engine Optimization Agencies," "KubeCon India 2026: Attendee Guide"), July's 14 shift toward GitHub and DevTools marketing ("Top GitHub Marketing Agencies for Open Source Companies," "GitHub Marketing Strategies," plus a Qodo/MemClaw case study), and August's 8 pivot toward a new theme entirely, so you can see exactly what the summary numbers represent rather than taking them on faith.
Ask for analysis and takeaways
With the raw numbers and the full title list already in the conversation, ask Claude to interpret what it means, for example:
"can you give me analysis and takeaways from this data please"
Claude names the trends directly rather than restating the table:
- Volume and execution are diverging. Topics queued per sprint nearly tripled over three months (10 to 25 to 32), but the share actually getting published fell just as sharply (90% to 56% to 25%). Claude calls this the single most important trend in the data: the team is planning more content than it can ship, and the gap is widening every month.
- Performance tracks what got published, not sprint size. June queued the fewest topics but had the highest completion rate, delivering solid results (14 clicks, 2,010 impressions) from just 9 posts. July, with more than double the published output, more than doubled the results too (50 clicks, 3,873 impressions), meaning July's topics weren't just more numerous, they were also higher-intent. August, despite queuing the most topics ever, published the fewest and shows no measurable search performance yet, and Claude is careful to note why: GSC data takes 2 to 3 weeks to populate, and most August posts went live in the back half of the month.
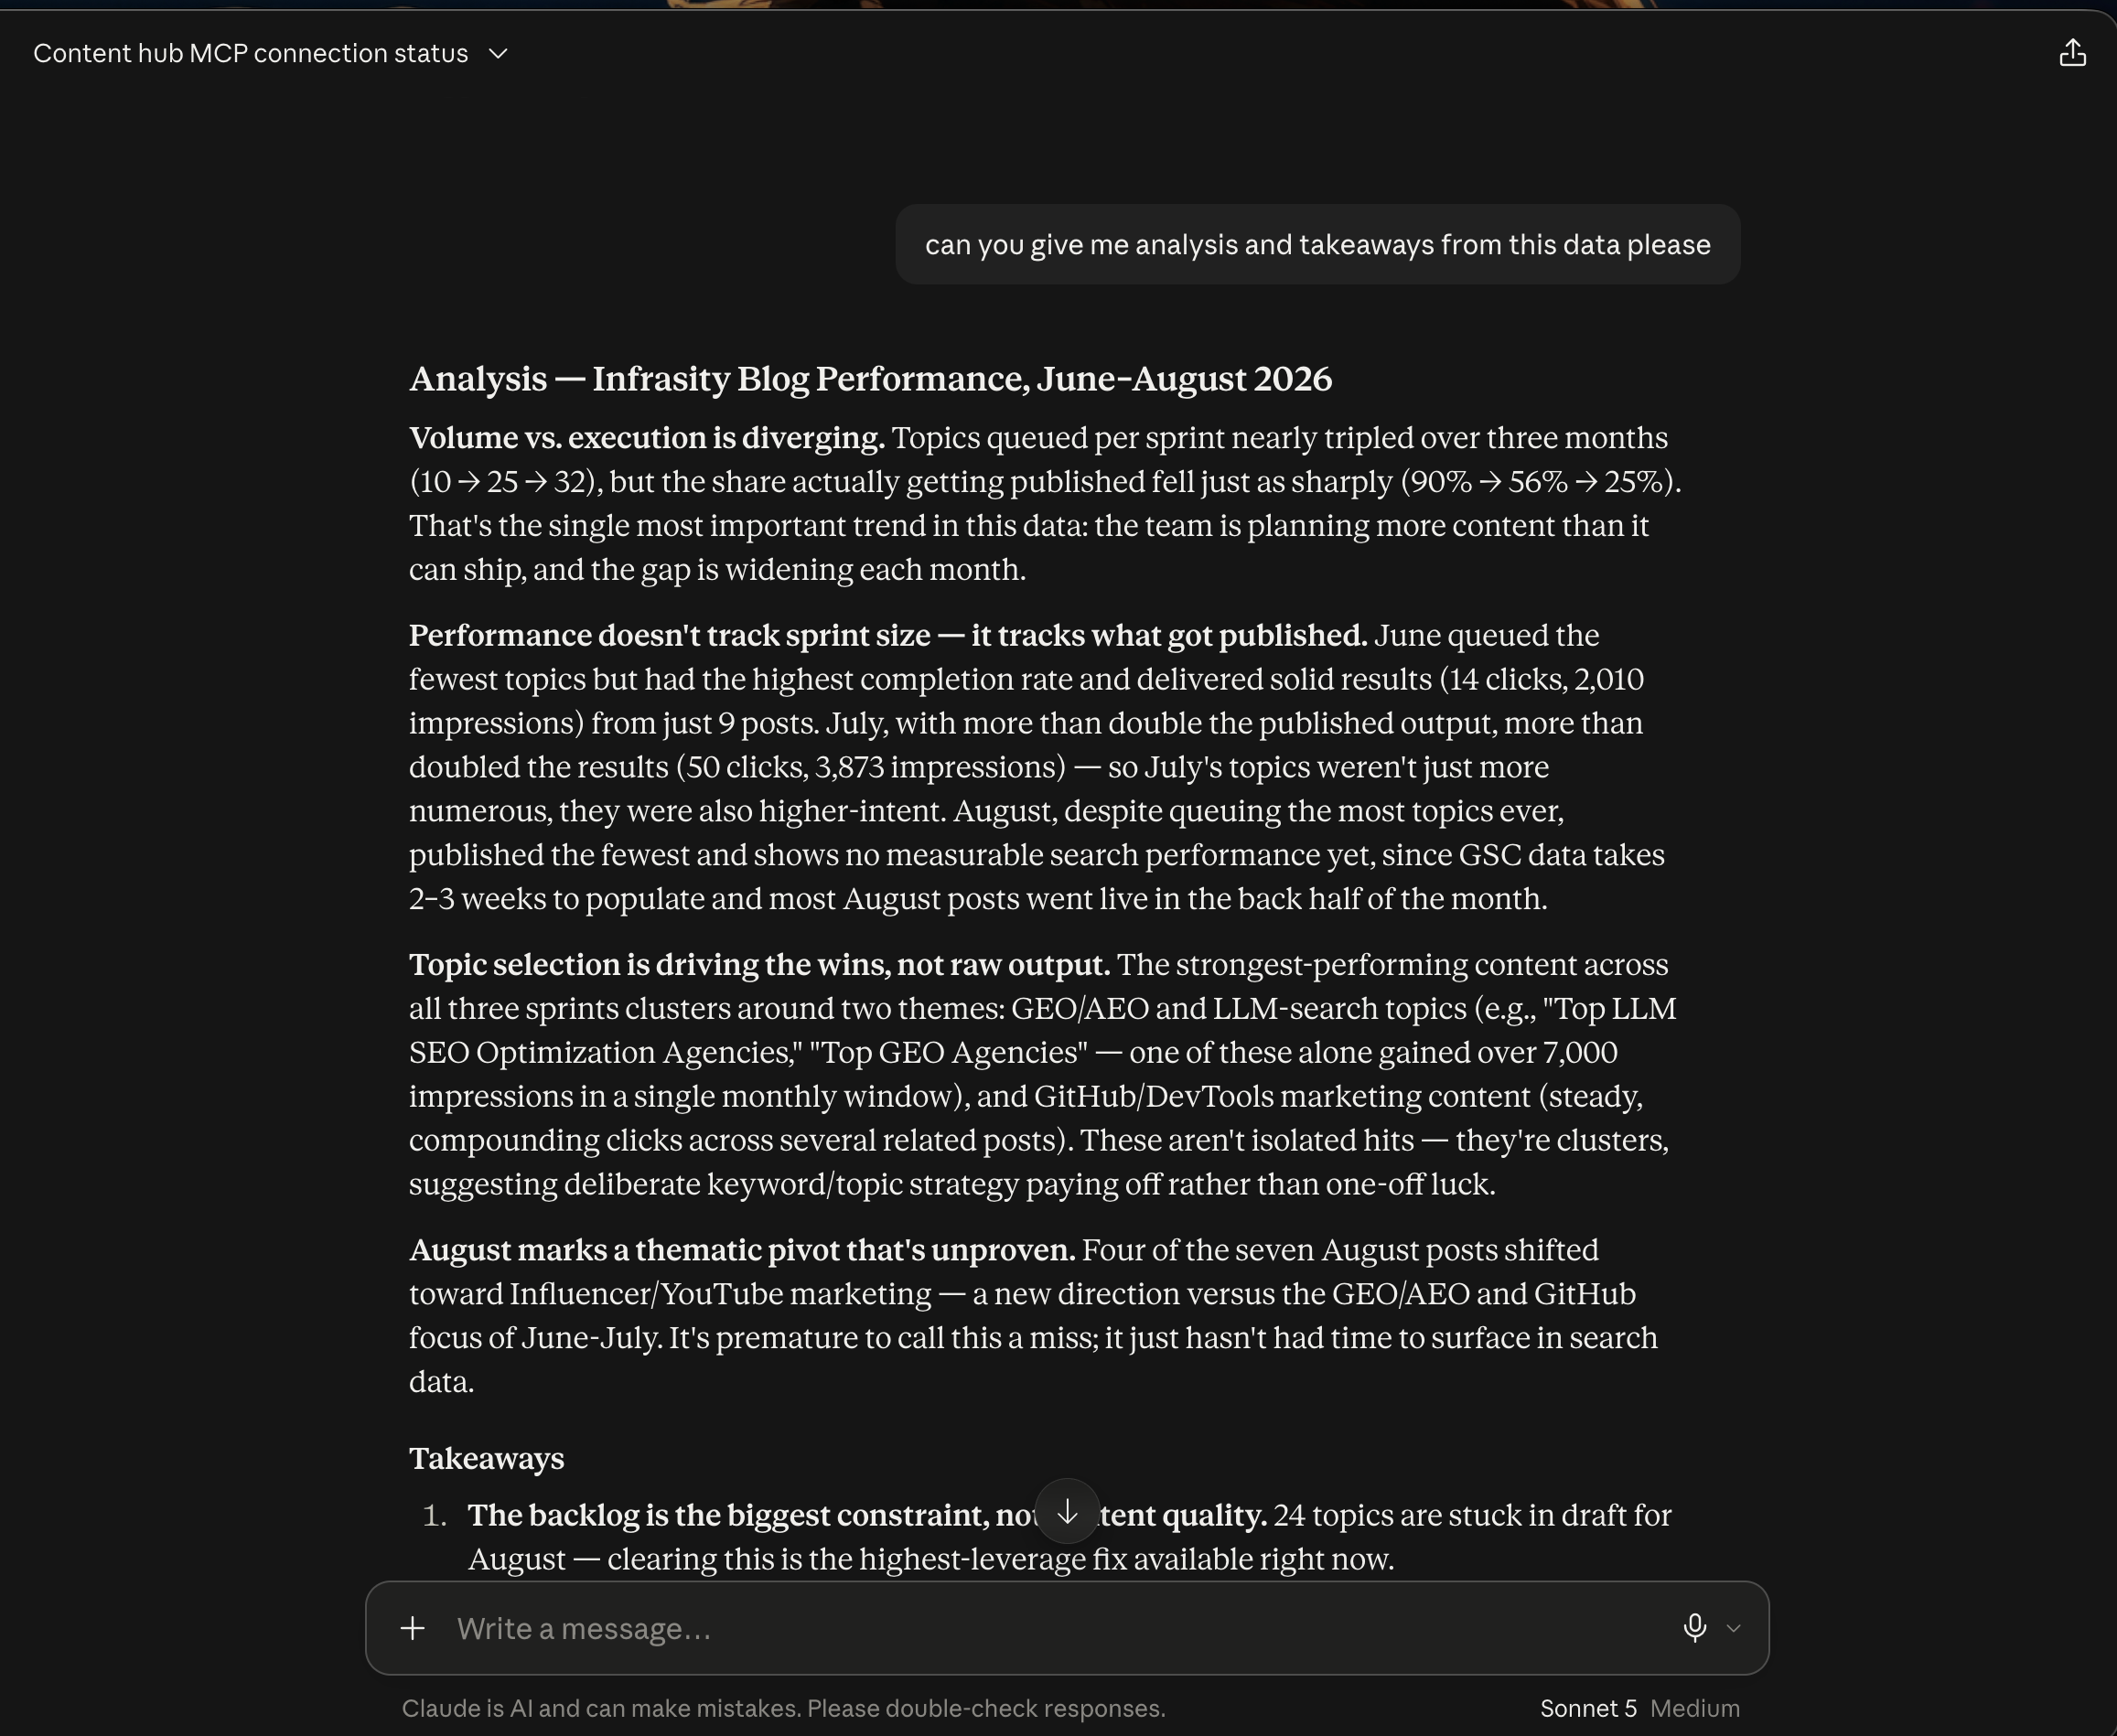
- Topic selection is driving the wins, not raw output. The strongest-performing content across all three sprints clusters around two themes: GEO/AEO and LLM-search topics like "Top LLM SEO Optimization Agencies" and "Top GEO Agencies" (one of these alone gained over 7,000 impressions in a single month), and GitHub/DevTools marketing content delivering steady, compounding clicks across several related posts. Claude's read: these aren't isolated hits, they're clusters, suggesting a deliberate keyword and topic strategy paying off rather than one-off luck.
- August marks a thematic pivot that's unproven. Four of the seven August posts shifted toward a new theme, Influencer and YouTube marketing, versus the GEO/AEO and GitHub focus of June and July. Claude is careful not to call this a miss prematurely, it just hasn't had time to surface in search data yet.
It closes with a numbered takeaways list, each paired with a specific action: clear the draft backlog first (24 topics are stuck in draft for August alone) since that's the highest-leverage fix available right now, keep doubling down on GEO/AEO and LLM-search content as the fastest-growing performer, keep feeding the GitHub/DevTools cluster as a steady compounding asset, hold off judging August until early-to-mid September once indexing catches up, and treat July, not June or August, as the sprint worth repeating since it balanced volume with a strong publish rate and the best per-post performance of the three.
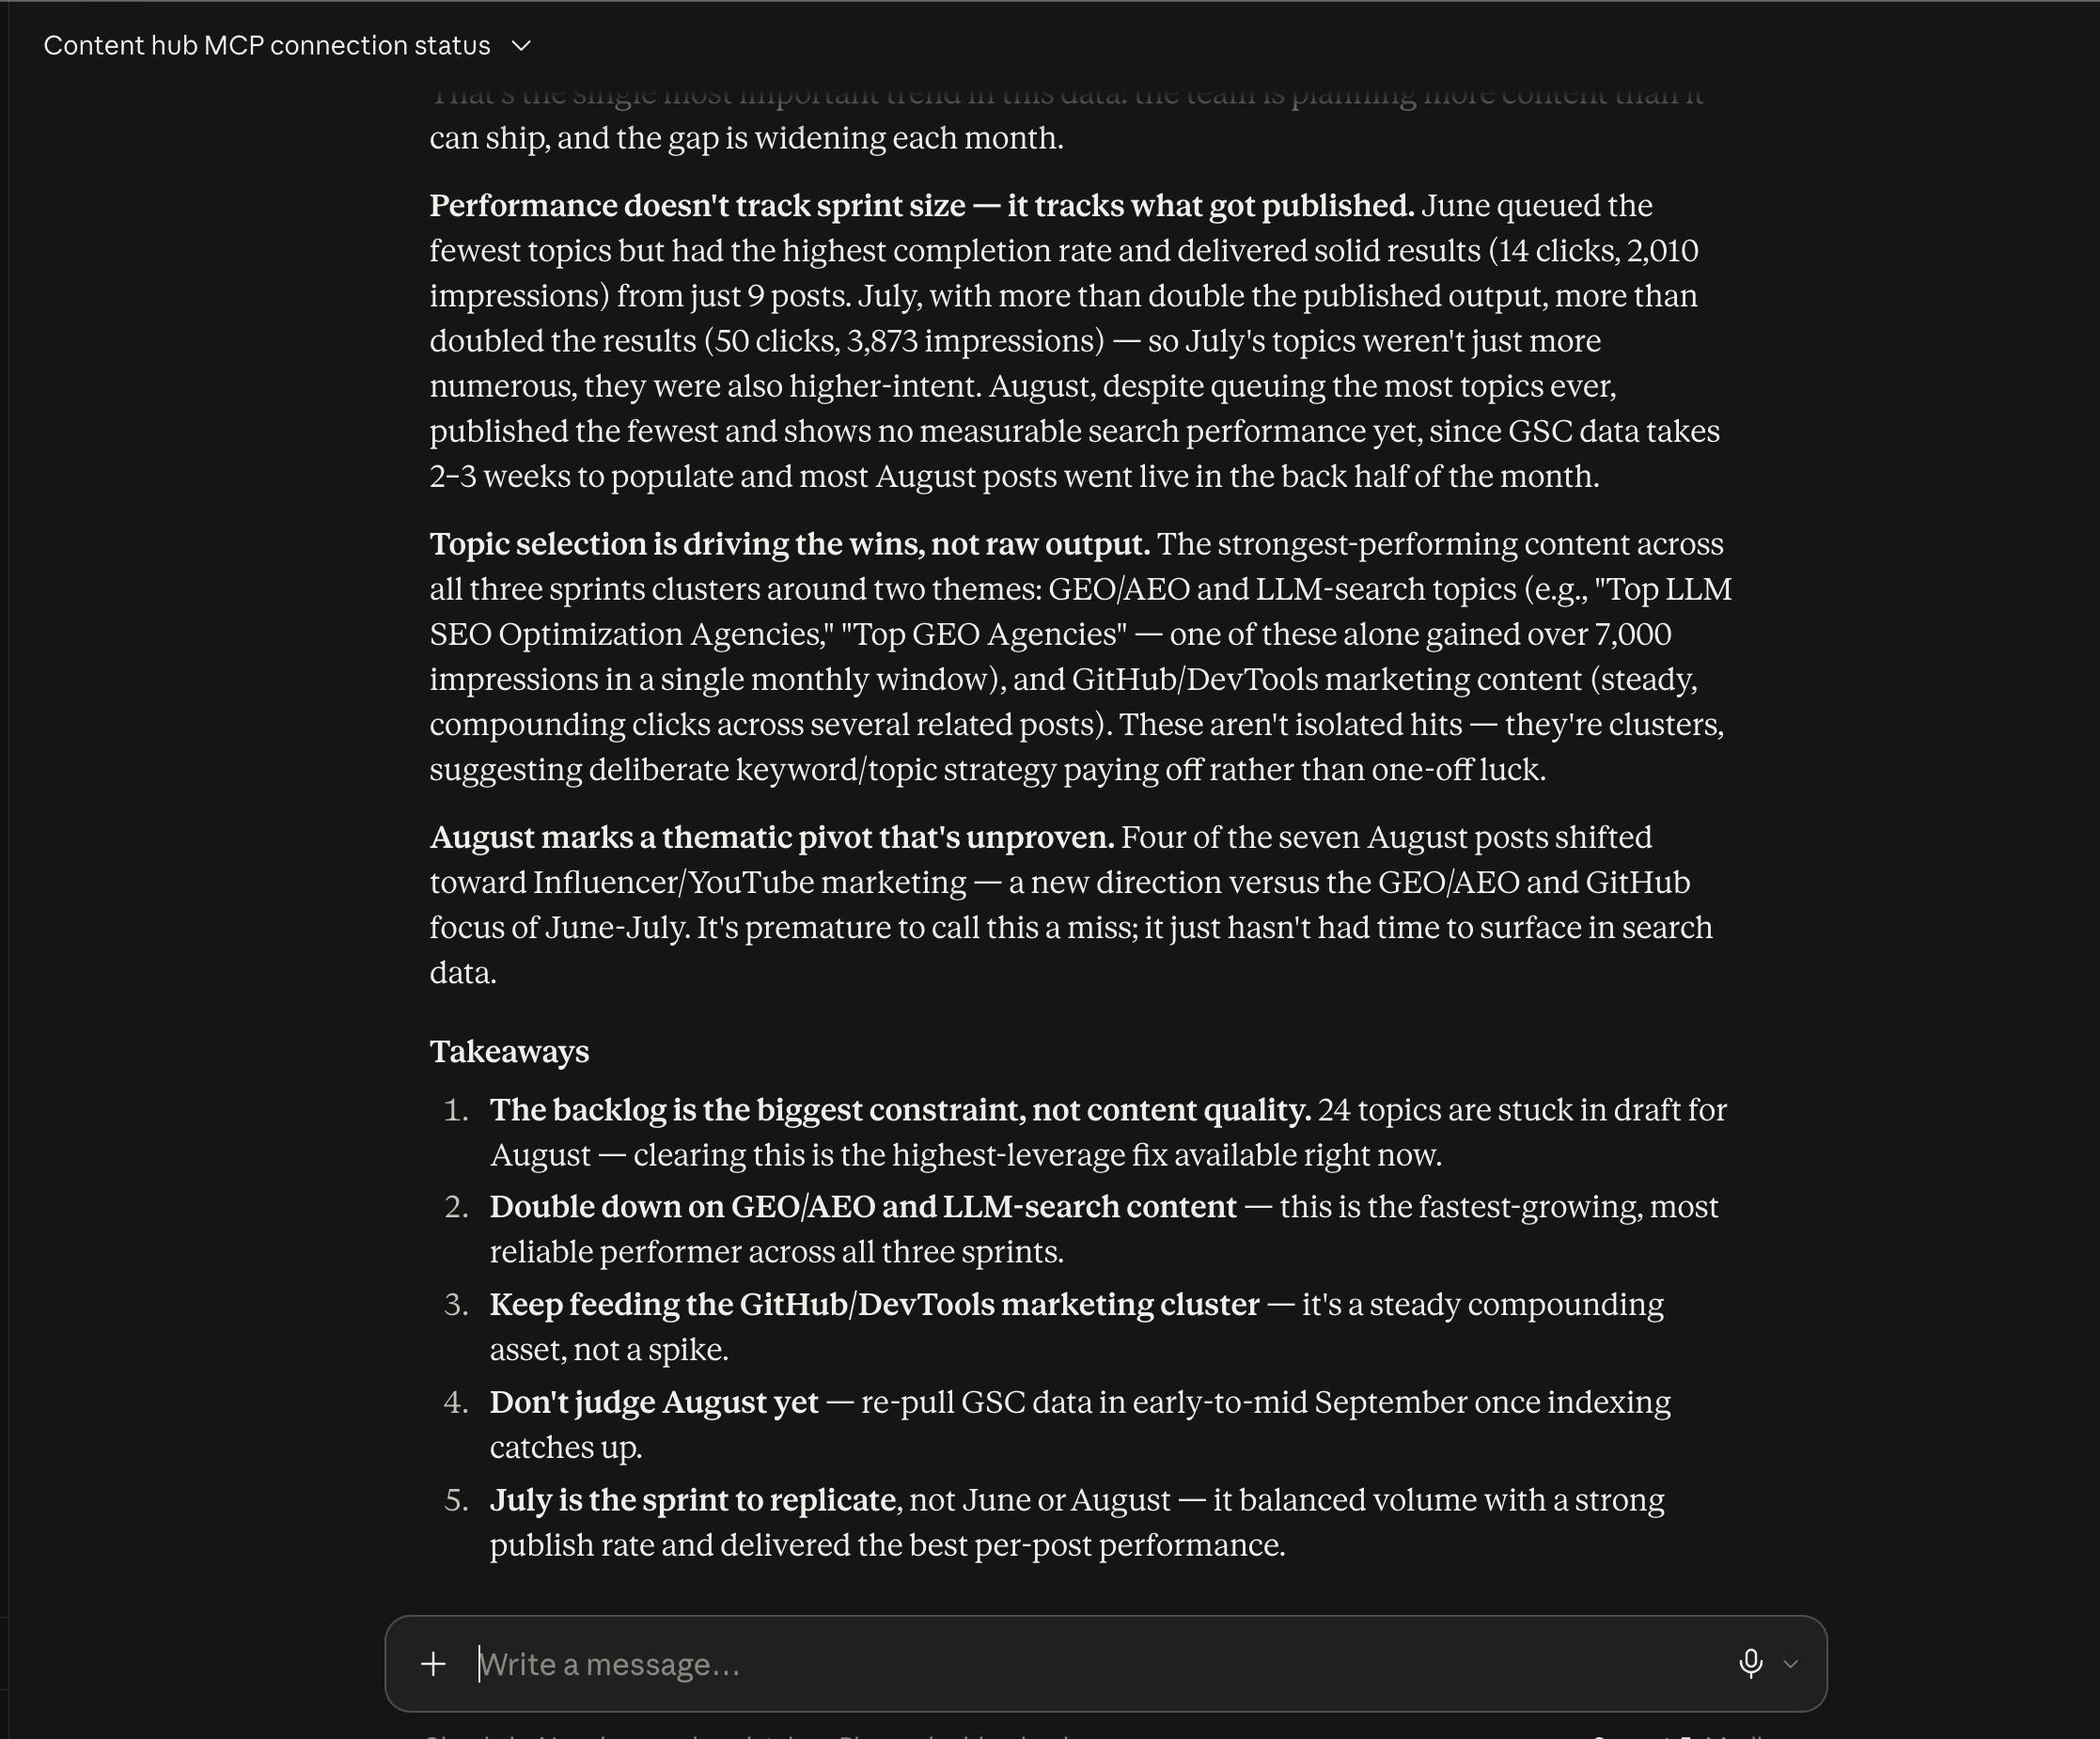
A three-month range typed in one message turns into a chart, a full publish log, and a prioritized set of takeaways, all inside one Claude Desktop conversation.
Open app.infrasity.com and pull your last few sprints to see whether your team is publishing more than it's actually shipping.
How to Fetch the GSC and GA4 Data Using Content Hub MCP
Pull Google Search Console and GA4 data for any page straight into a Claude Desktop chat, then have Claude interpret it instead of cross-referencing two dashboards by hand.
How to Run a Freshness Audit and Prioritize What to Update
Audit your whole published library for stale content in one message over Content Hub MCP, and get back a prioritized, reasoned list of what to fix first.