How to Create a GEO Cluster, Add Prompts, and Track Citations via MCP
Create a new GEO cluster, populate it with prompts either directly or by scanning your site, and read the resulting citation and visibility data, all from a Claude Desktop chat over Content Hub MCP.
A GEO cluster is a themed group of prompts that Content Hub runs against AI models on a recurring schedule to see whether your site gets cited back. Before any of the citation tracking and dashboards work, a cluster has to exist and has to have prompts attached to it. Once Claude Desktop is connected to Content Hub via MCP, you can create that cluster, fill it with prompts, and then read back how it's performing, all without leaving the chat.
Before you start, make sure Claude Desktop is connected to Content Hub via MCP (see the Content Hub MCP setup guide if you haven't done that yet).
Here's the flow, from an empty cluster to a live citation dashboard.
Create a new GEO cluster
Name the cluster and tell Claude which domain it should track, for example:
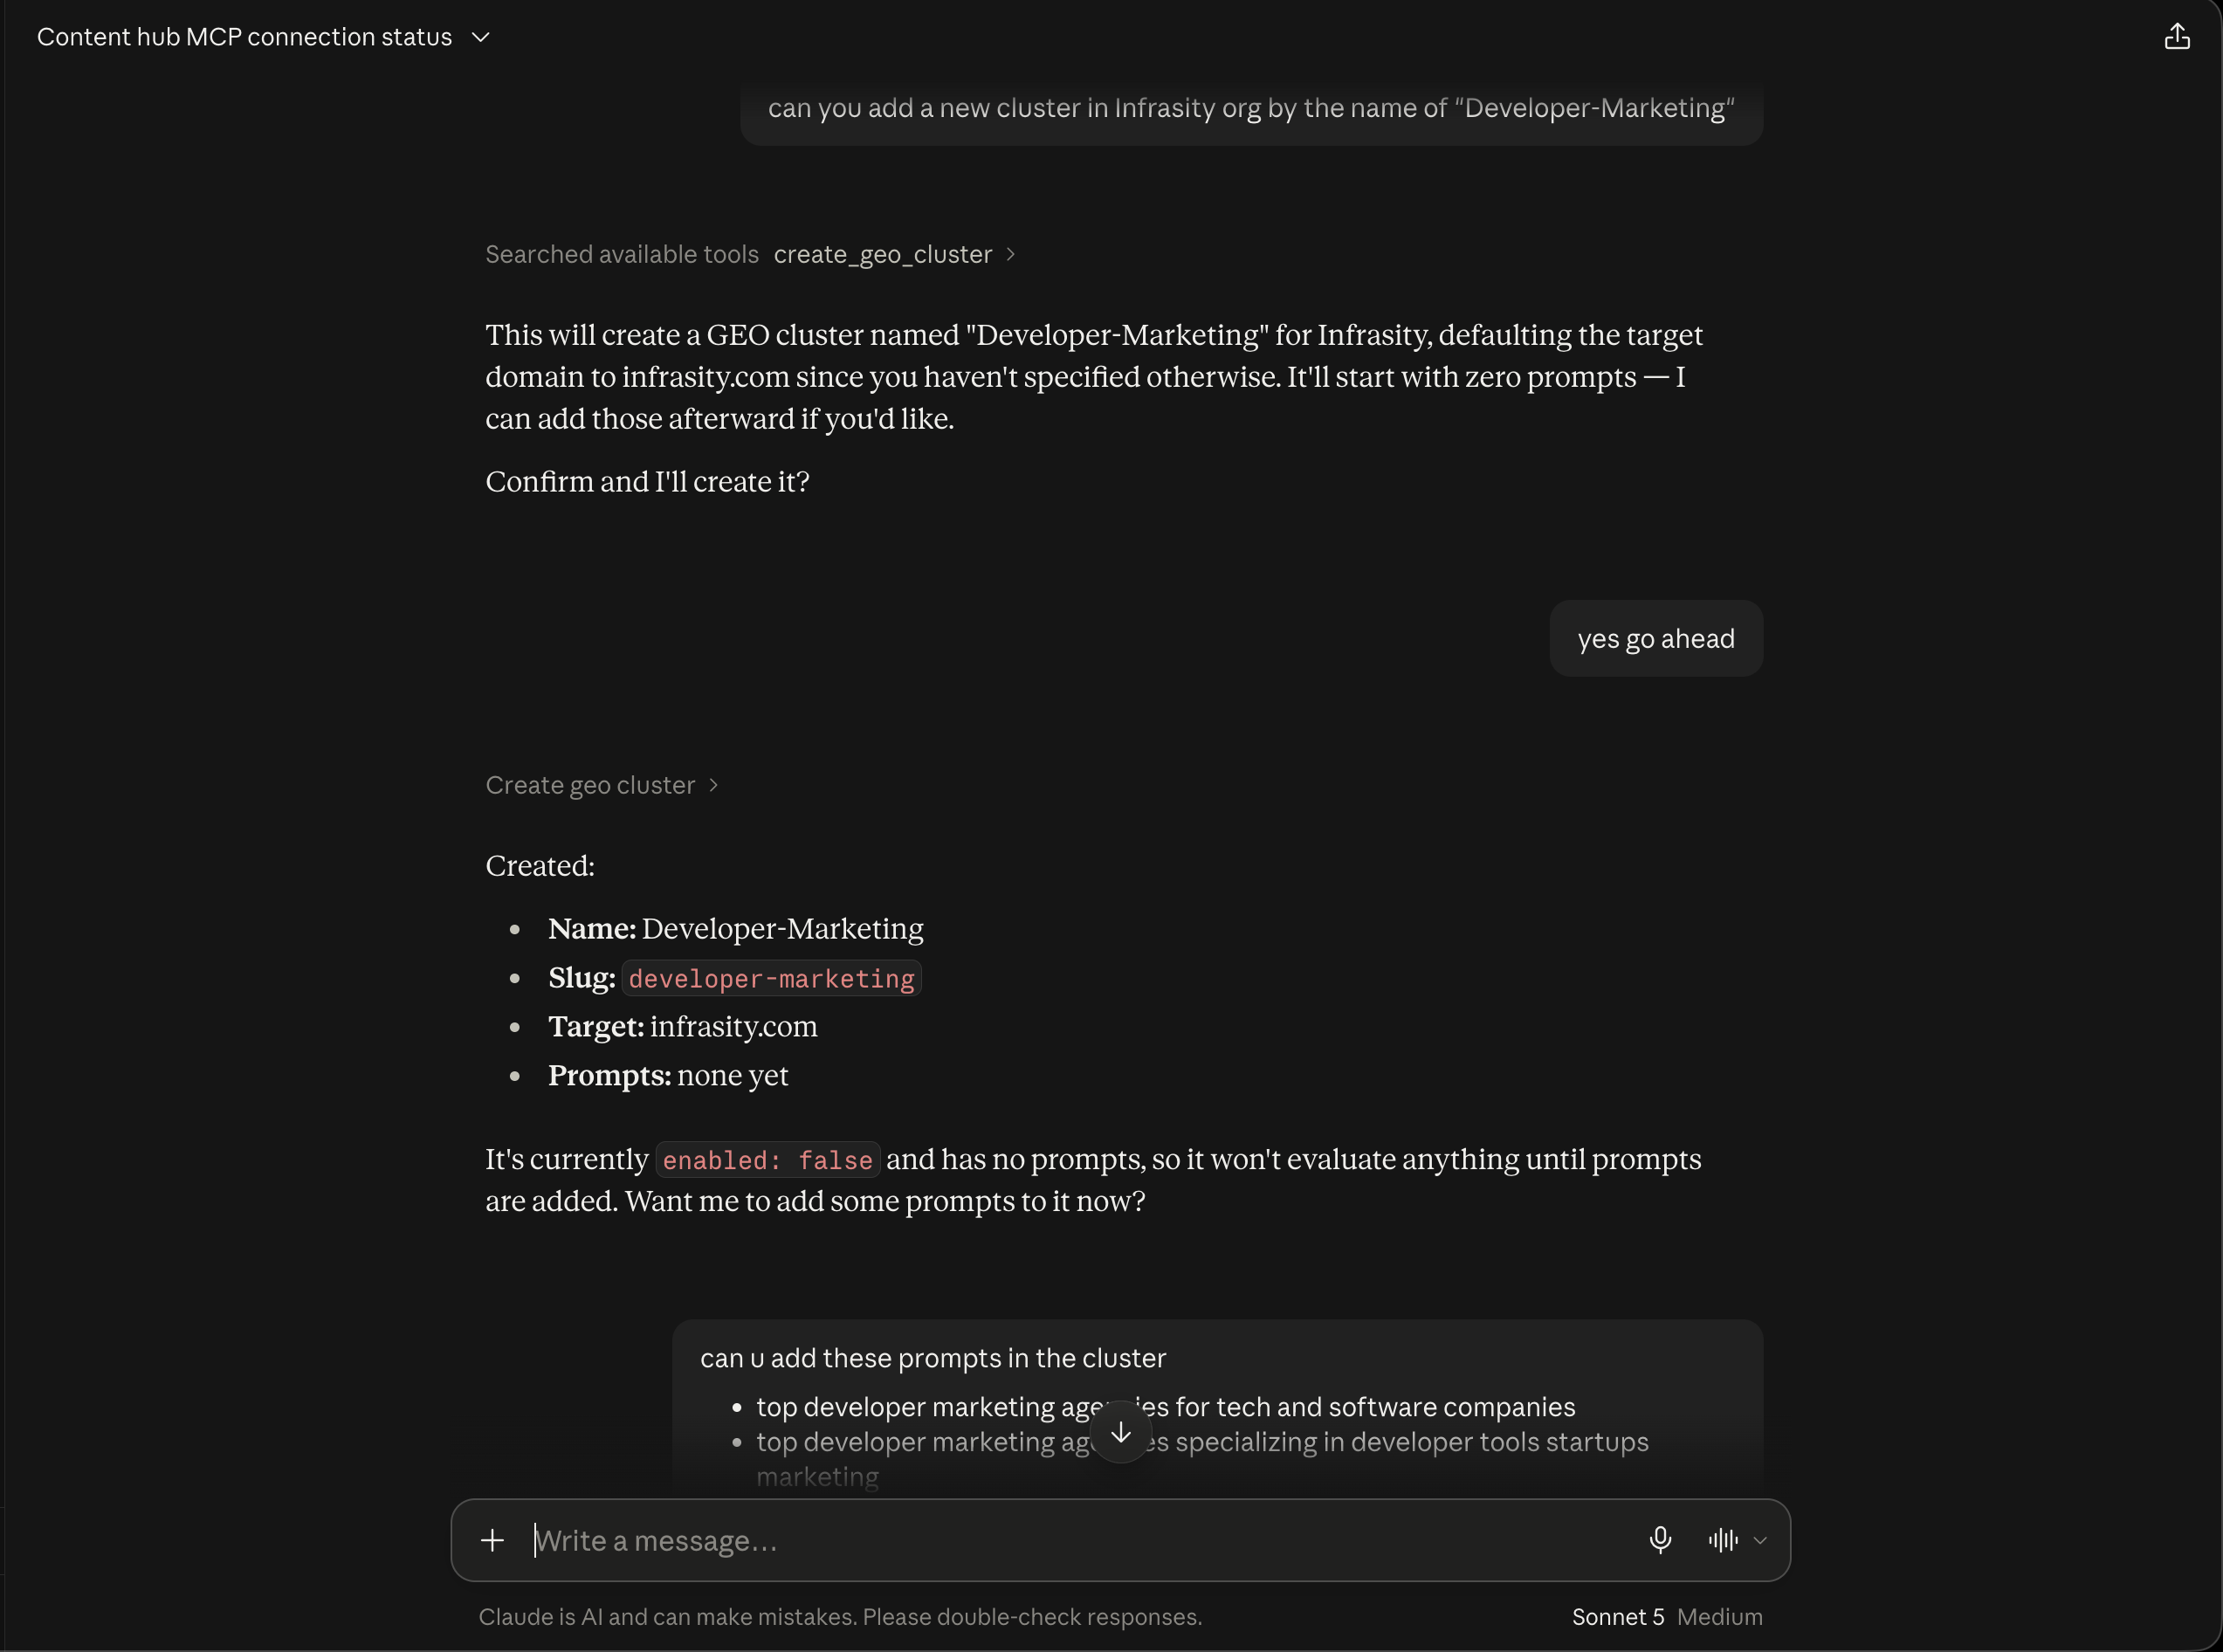
"can you create a new GEO cluster in Infrasity org named Developer Marketing tracking infrasity.com"
Claude creates the cluster and returns its confirmed details: name Developer Marketing,
slug developer-marketing, target domain infrasity.com. It comes back with zero prompts and
enabled: false, since a cluster with nothing tracked in it has nothing to run yet, so there's
no reason to switch monitoring on before it's actually populated. Claude closes by asking
whether you want to add prompts now, which is the only thing standing between this cluster and
its first real run.
Add prompts to the cluster
A cluster only tracks what you tell it to. There are two ways to get prompts into one, and which one you reach for depends on whether you already know what you want to track.
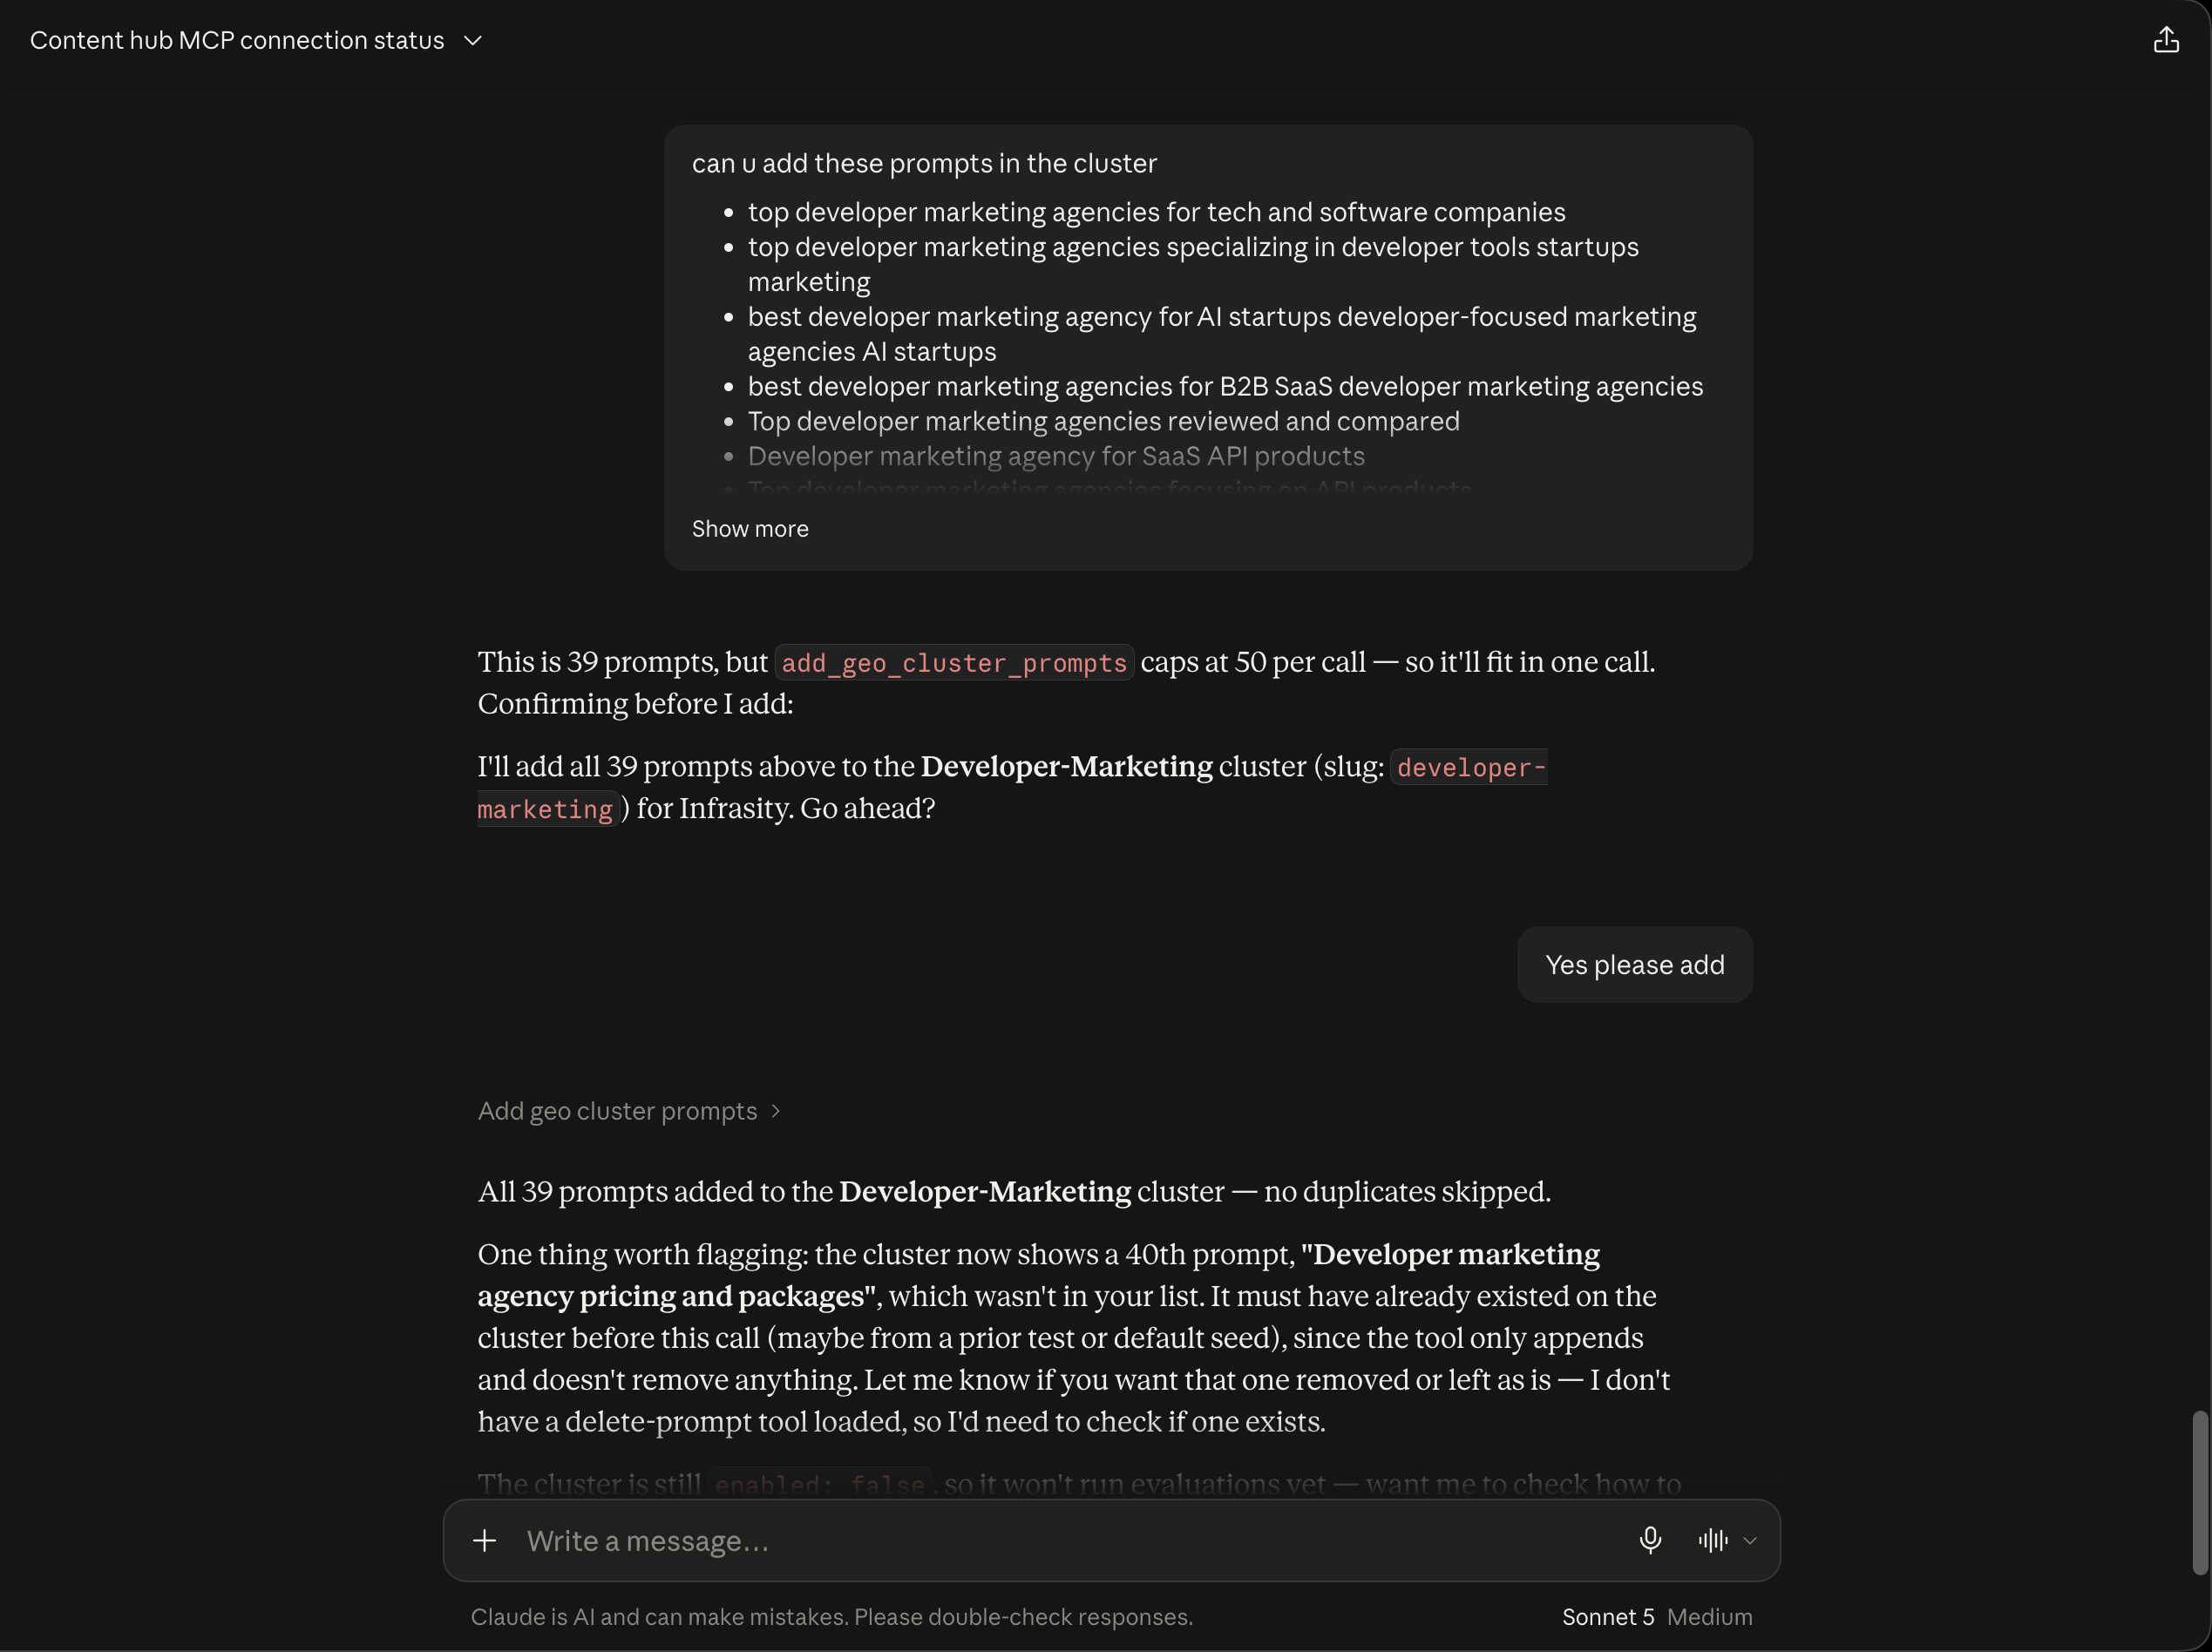
Option A: hand Claude a list directly. If you already have a set of queries in mind, paste
them in as-is, for example a list of prompts like "top developer marketing agencies specializing
in developer tools" and "best developer marketing agency for AI startups." Claude adds the whole
batch in a single call, though it's worth knowing each add_geo_cluster_prompts call caps out
at 50 prompts, so a much larger list would need to be split across a couple of requests. Claude
confirms exactly how many landed once it's done, which is the quickest way to sanity-check that
everything you pasted actually made it onto the cluster.
Option B: let Content Hub generate the list for you. If you don't already have queries mapped out, Content Hub's own UI can do that legwork instead of you having to hand-type five dozen search phrases. From the cluster's Recommendations tab, Scan Website Themes crawls your site to work out what it's actually about, and Generate Theme Prompts turns those themes into ready-to-add prompt suggestions. It's the slower option since it depends on a crawl, but it's the better one when you're starting a cluster from scratch and don't yet know which phrasings are worth tracking.

Either way, once prompts are attached, flip the cluster on so it actually starts running:
"great, now enable the cluster"
Read the citation and visibility dashboard
Once a cluster has run a few times, its GEO Overview dashboard turns raw prompt results into a handful of numbers worth checking regularly.
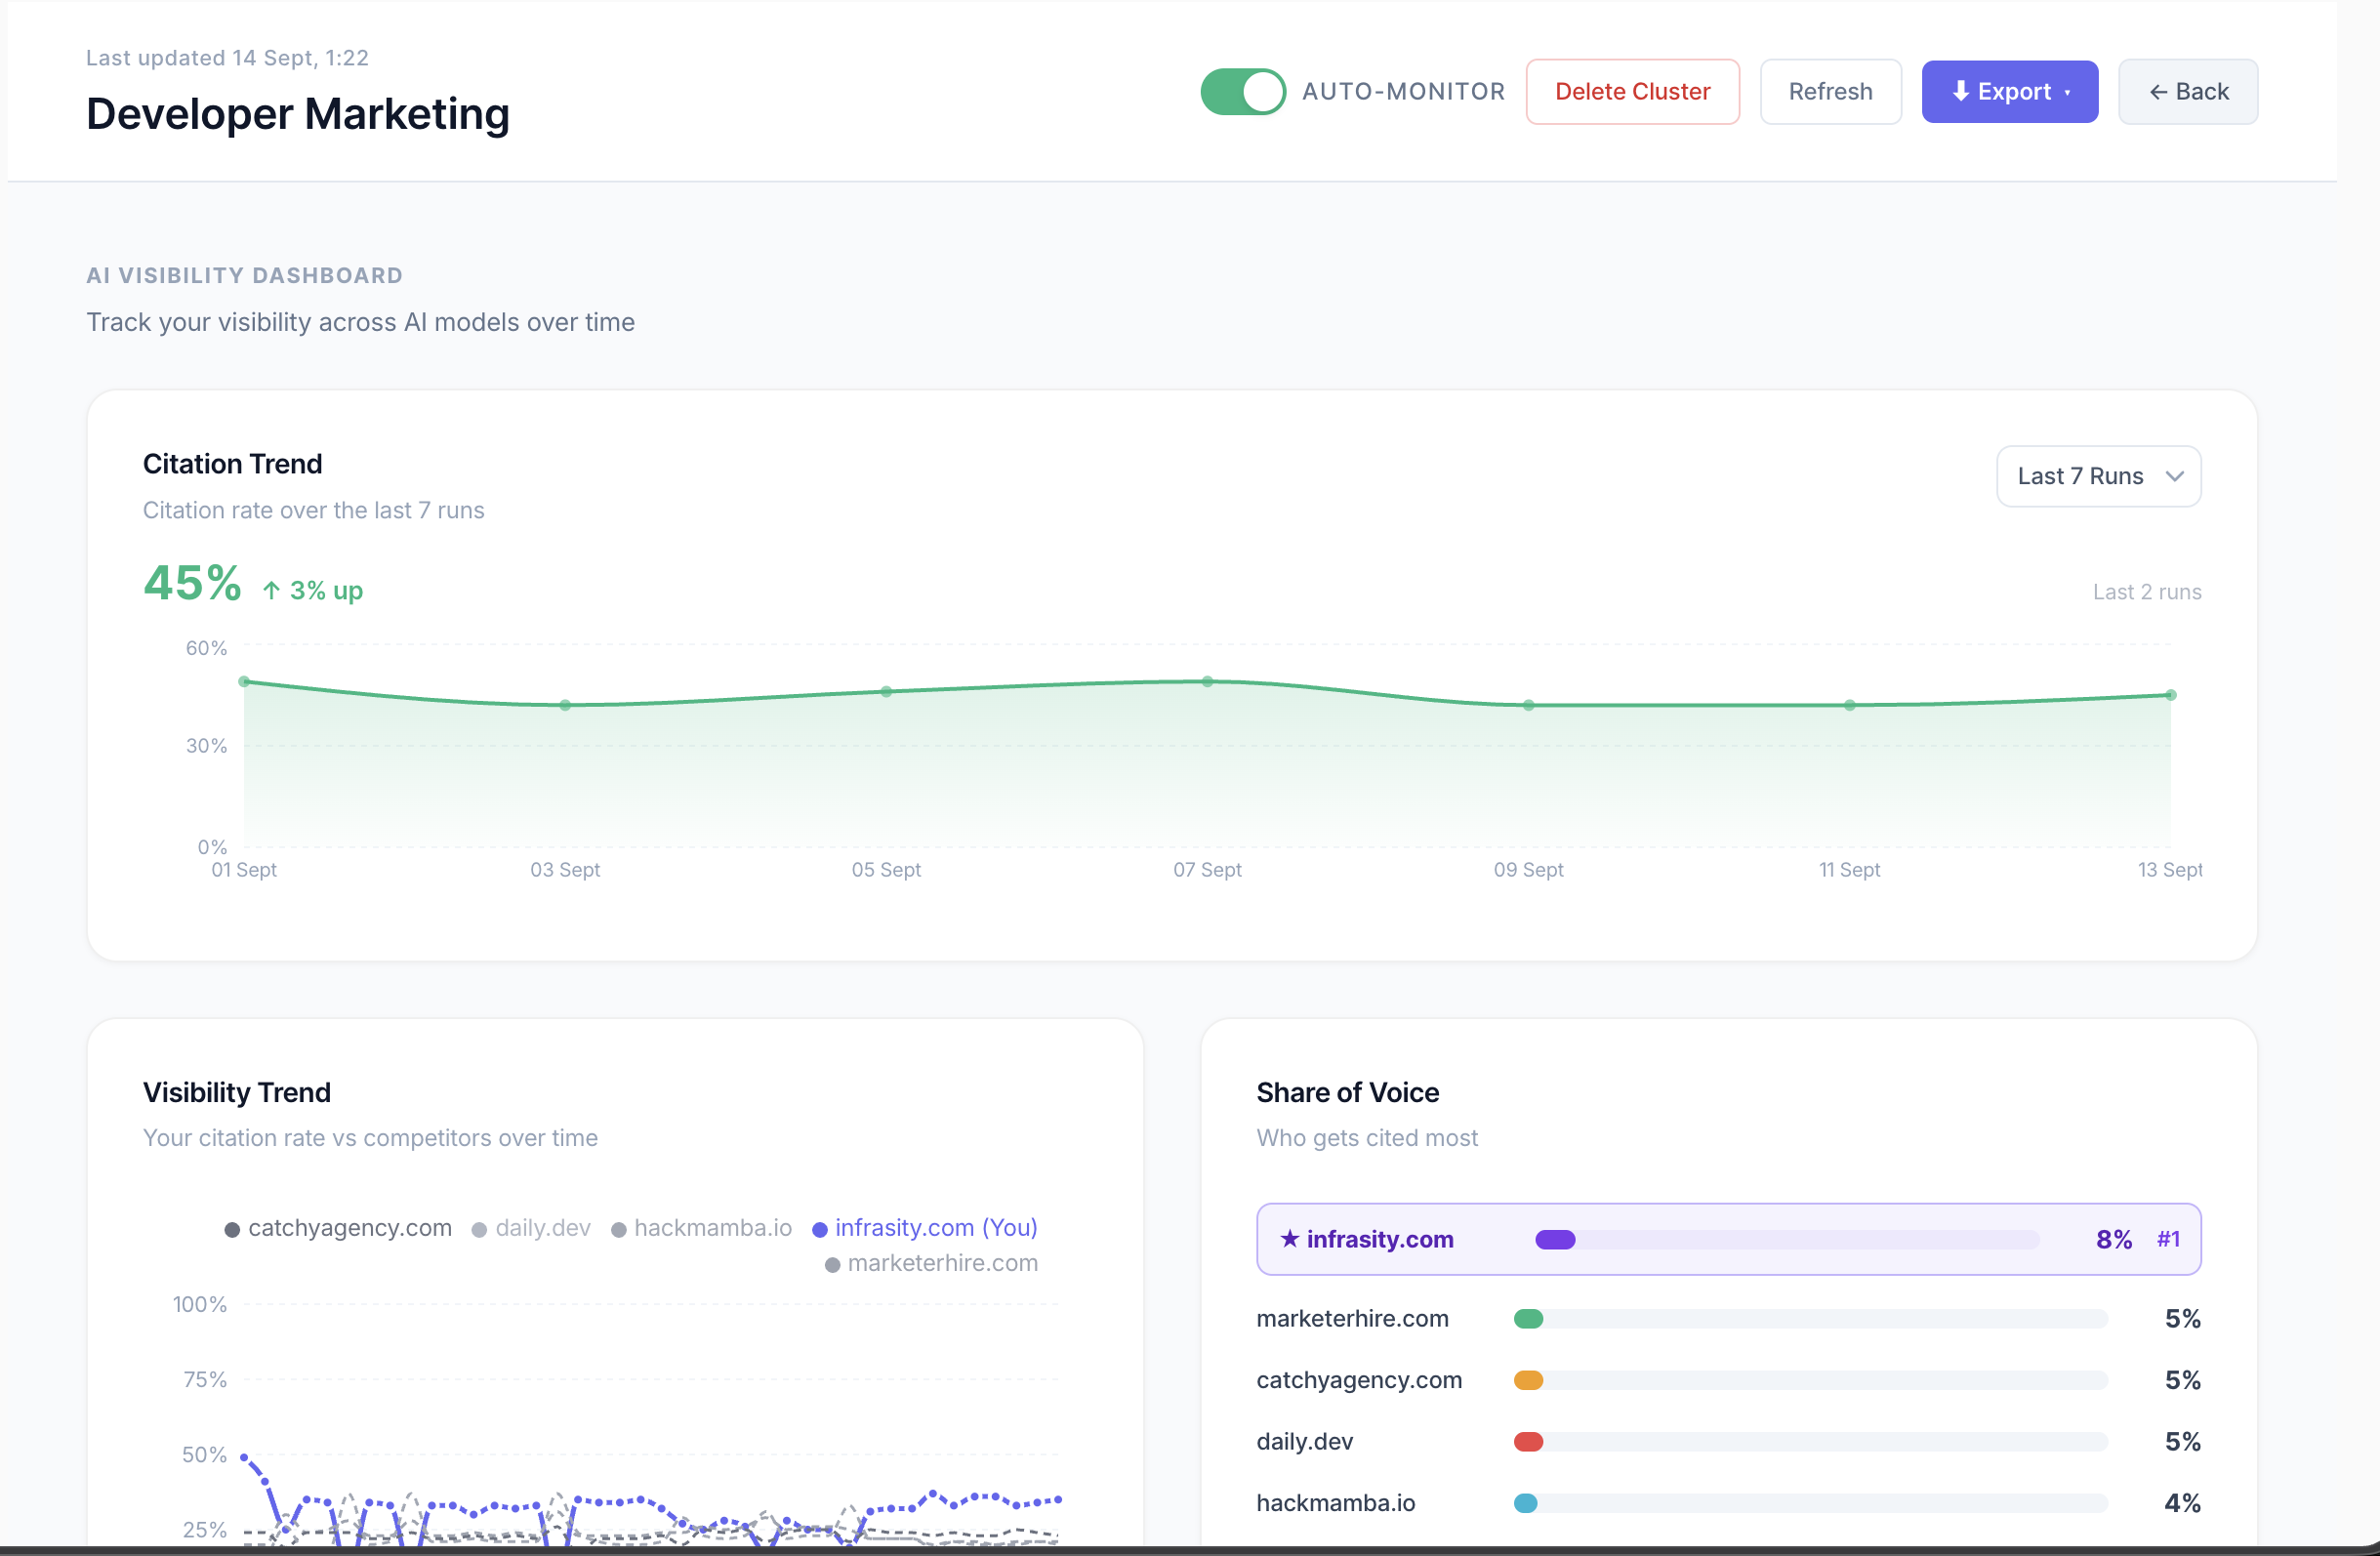
Citation Trend is the headline number: what share of tracked prompts cited your domain over the selected window, here 45%, up 3 points over the last two runs. It's a single trendline, so it's the fastest way to tell whether visibility is climbing or slipping before digging into individual prompts.
Visibility Trend plots that same citation rate against named competitors on one chart
(here catchyagency.com, daily.dev, hackmamba.io, marketerhire.com against
infrasity.com), which matters because a citation rate can look fine in isolation while
actually trailing every competitor tracked on the same prompts.
Share of Voice answers a narrower question: among domains that do get cited, who gets cited
most often. Infrasity ranked #1 at 8% here, ahead of marketerhire.com, catchyagency.com, and
daily.dev at 5% each and hackmamba.io at 4%, a tight spread where a few percentage points is
the difference between first and fourth.
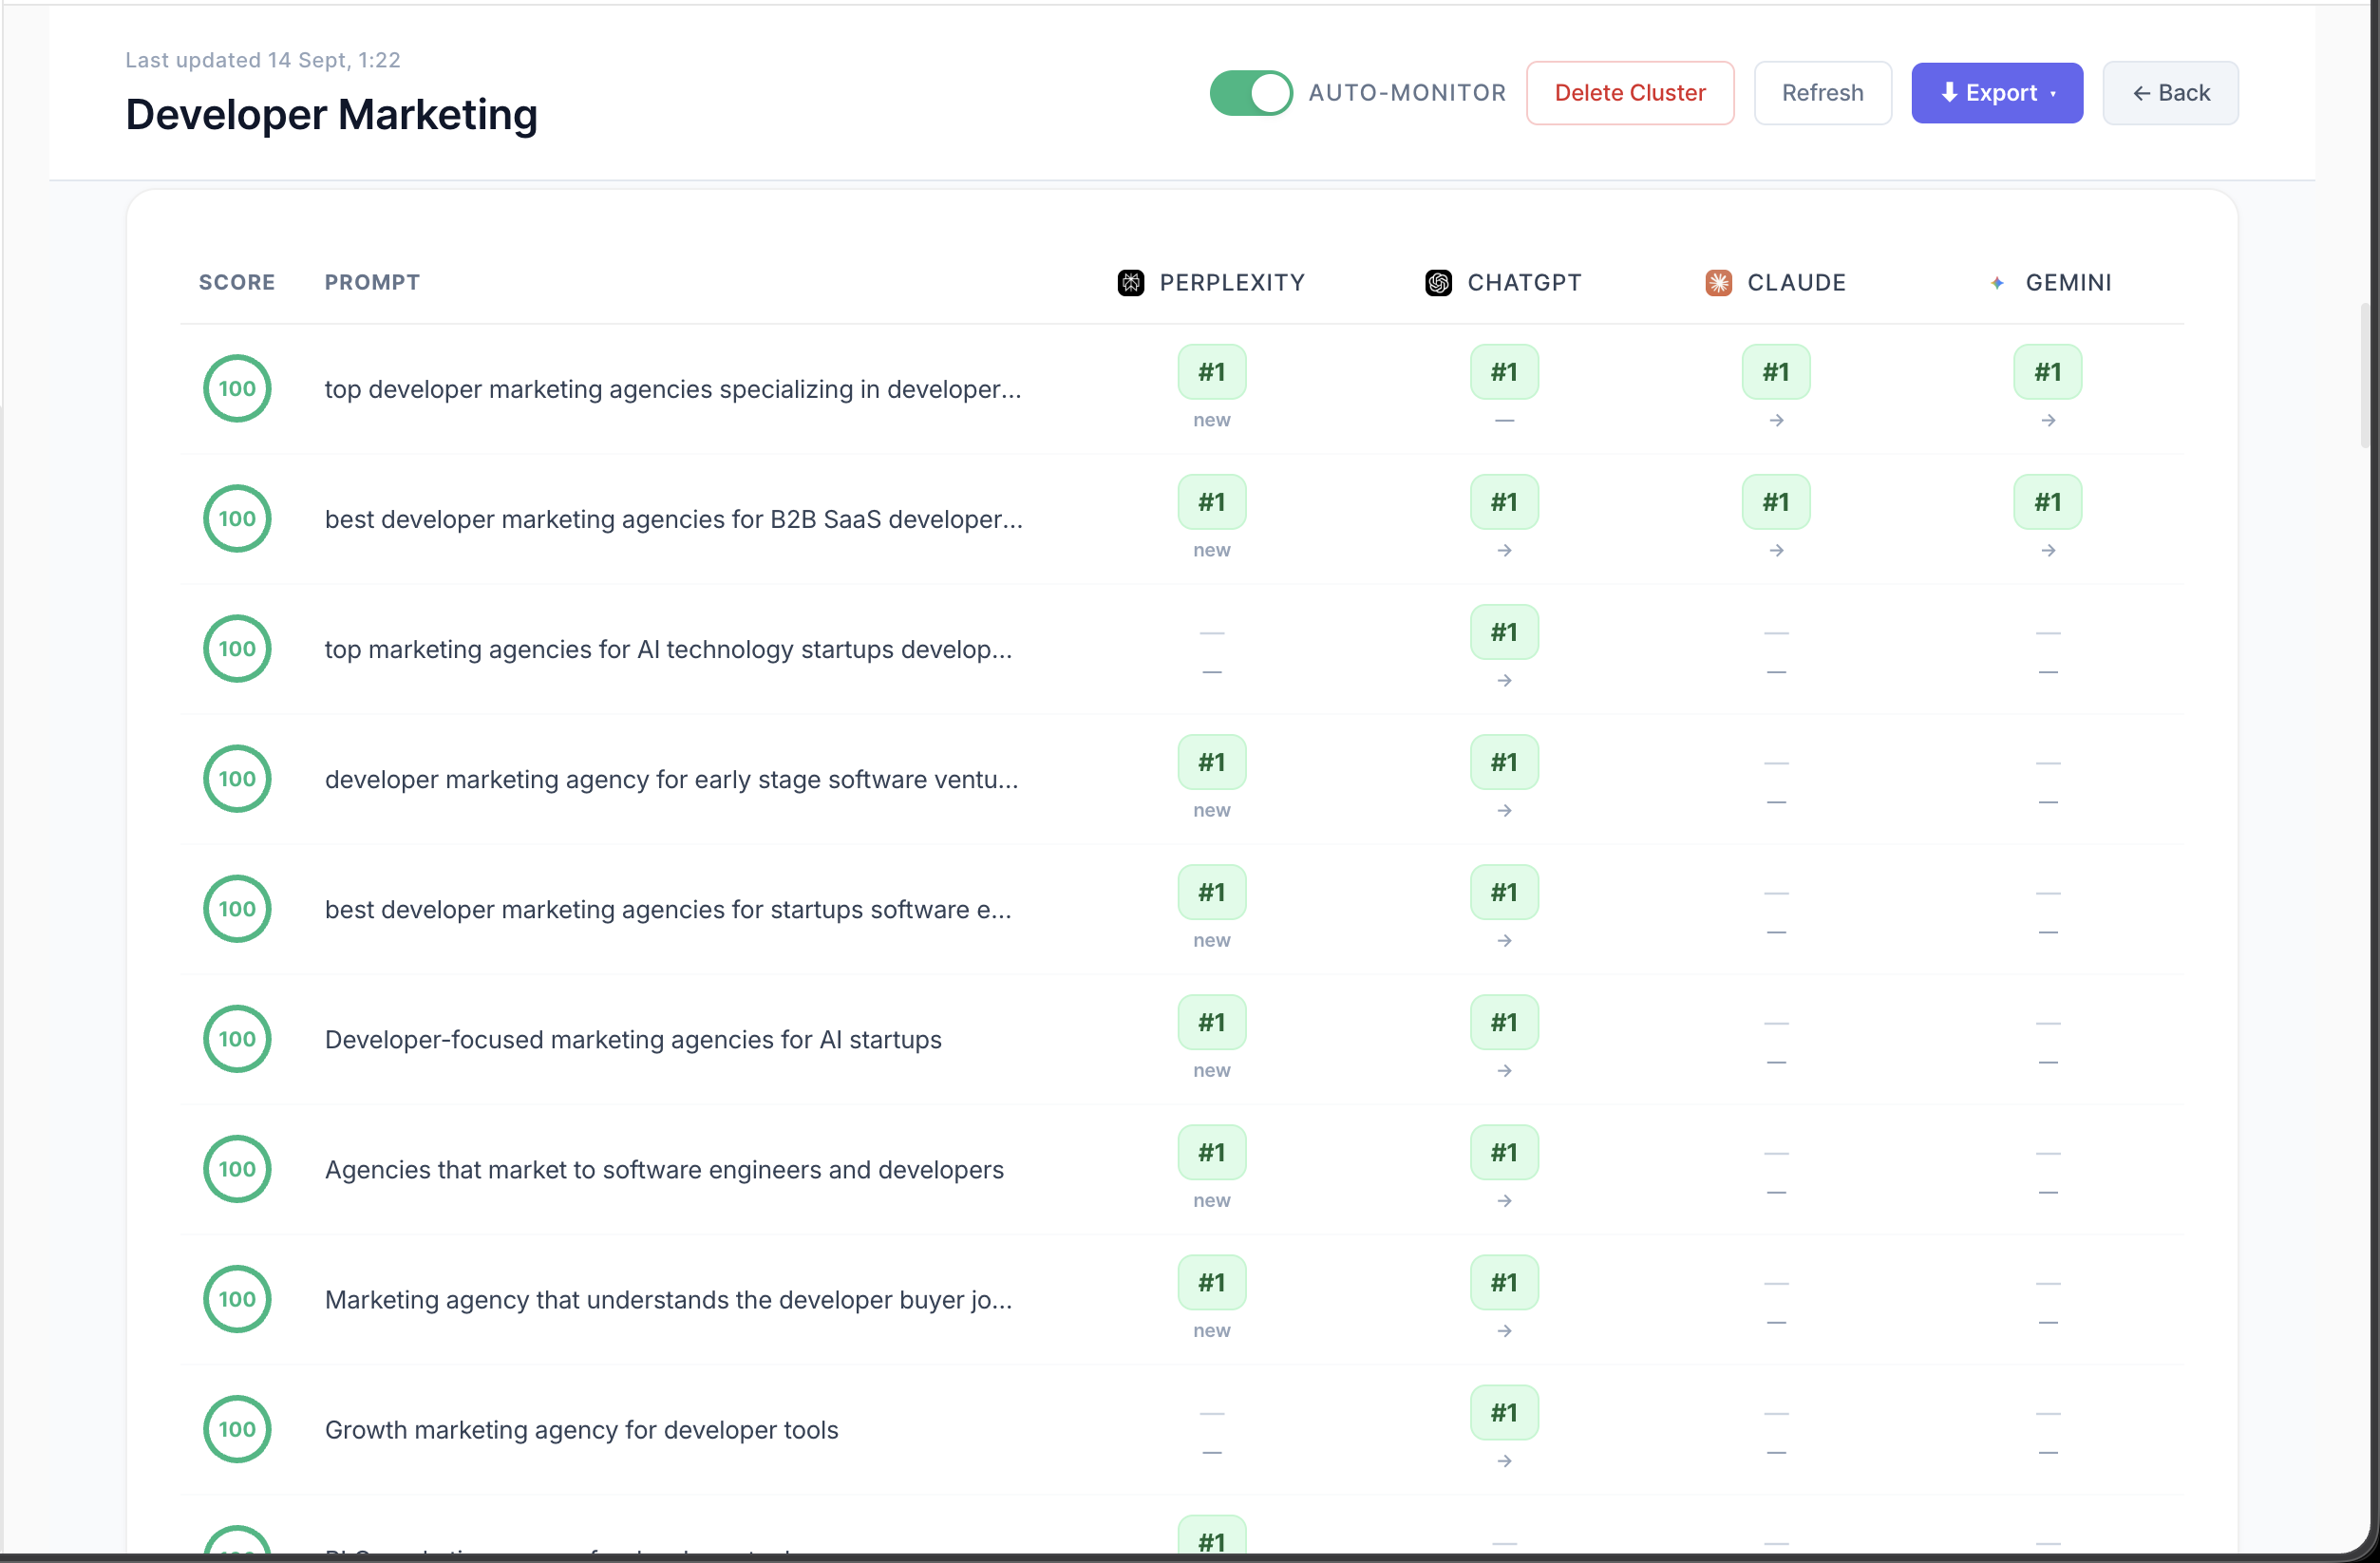
Below the summary cards, the prompt-level breakdown table is where the real diagnosis happens. Every tracked prompt gets a score out of 100 and a per-engine rank across Perplexity, ChatGPT, Claude, and Gemini, with an arrow showing whether that prompt moved since its last run. It's common to see a prompt score 100 while still showing a dash on two of the four engines, meaning it's winning wherever it's cited at all but isn't being surfaced by every model yet, a different problem than a low score, and one that needs a different fix.
Setting up a cluster is a one-time job, but the dashboard it feeds is worth returning to often: citation rate and share of voice shift as models refresh their answers, and the prompt-level table is usually where you'll spot the next thing worth fixing.
Head to app.infrasity.com and open your own GEO cluster to see where your citation rate and share of voice actually stand today.
Sprint Analysis: How to Get Sprint Data From Content Hub Using MCP
Pull sprint data, topics, publish status, GSC performance, and trend history straight into a Claude Desktop chat instead of clicking through the Sprints tab manually.
How to Track AI Share of Voice Across LLMs Using Content Hub MCP
Pull AI share of voice data for any GEO cluster straight into a Claude Desktop chat, then have Claude turn it into a prioritized content plan.