

What is Content Monitoring?
Content Monitoring refers to the process of analyzing digital content such as blogs, articles, and technical documents to ensure that it is still relevant, informative, and engaging.
Due to content's centrality in the SaaS conversion journey, monitoring it becomes integral to the product's growth.
For instance, let us assume your SaaS-based company makes online invoicing tools that help companies create, send, and track invoices, and you create content around finance and accounting for your company's website.
But what if new finance laws come into play? Or online invoicing suddenly becomes the default mode? All these changes in the finance world need to be reflected in your content. Therefore, you must periodically update the information in the content and infuse the new keywords that have popped up owing to the changes.
This is not all; content monitoring also includes many more technical aspects, such as monitoring the demographics that consume your content, the time they spend on your website, or even the channels from which they reach you!
All these insights help you make better and more competitive content that ultimately enables your SaaS product's growth. This blog delves into the intricacies and must-dos of content monitoring.
How to get content monitoring analytics?
Google makes incredible free content monitoring tools. The Google Search Console focuses on the website insights and its appearance in the search results. Google Analytics, on the other hand, is focused on the user front with insights on user interaction, demographics, and behavior. Let us explore these two tools that are imperative for website content monitoring.
Google Search Console
The Google Search Console is a report card of your website's performance. The console tells you which content resonates with your readers and brings significant traffic to your website. It also describes the average position of your content in the search results.
So, how is this data helpful other than making you feel good about your website? Well, it tells you what is working and what lacks, hence, where your scaling efforts should be focused.
Let's see the valuable insights provided by the console in detail.
1. Performance Metrics
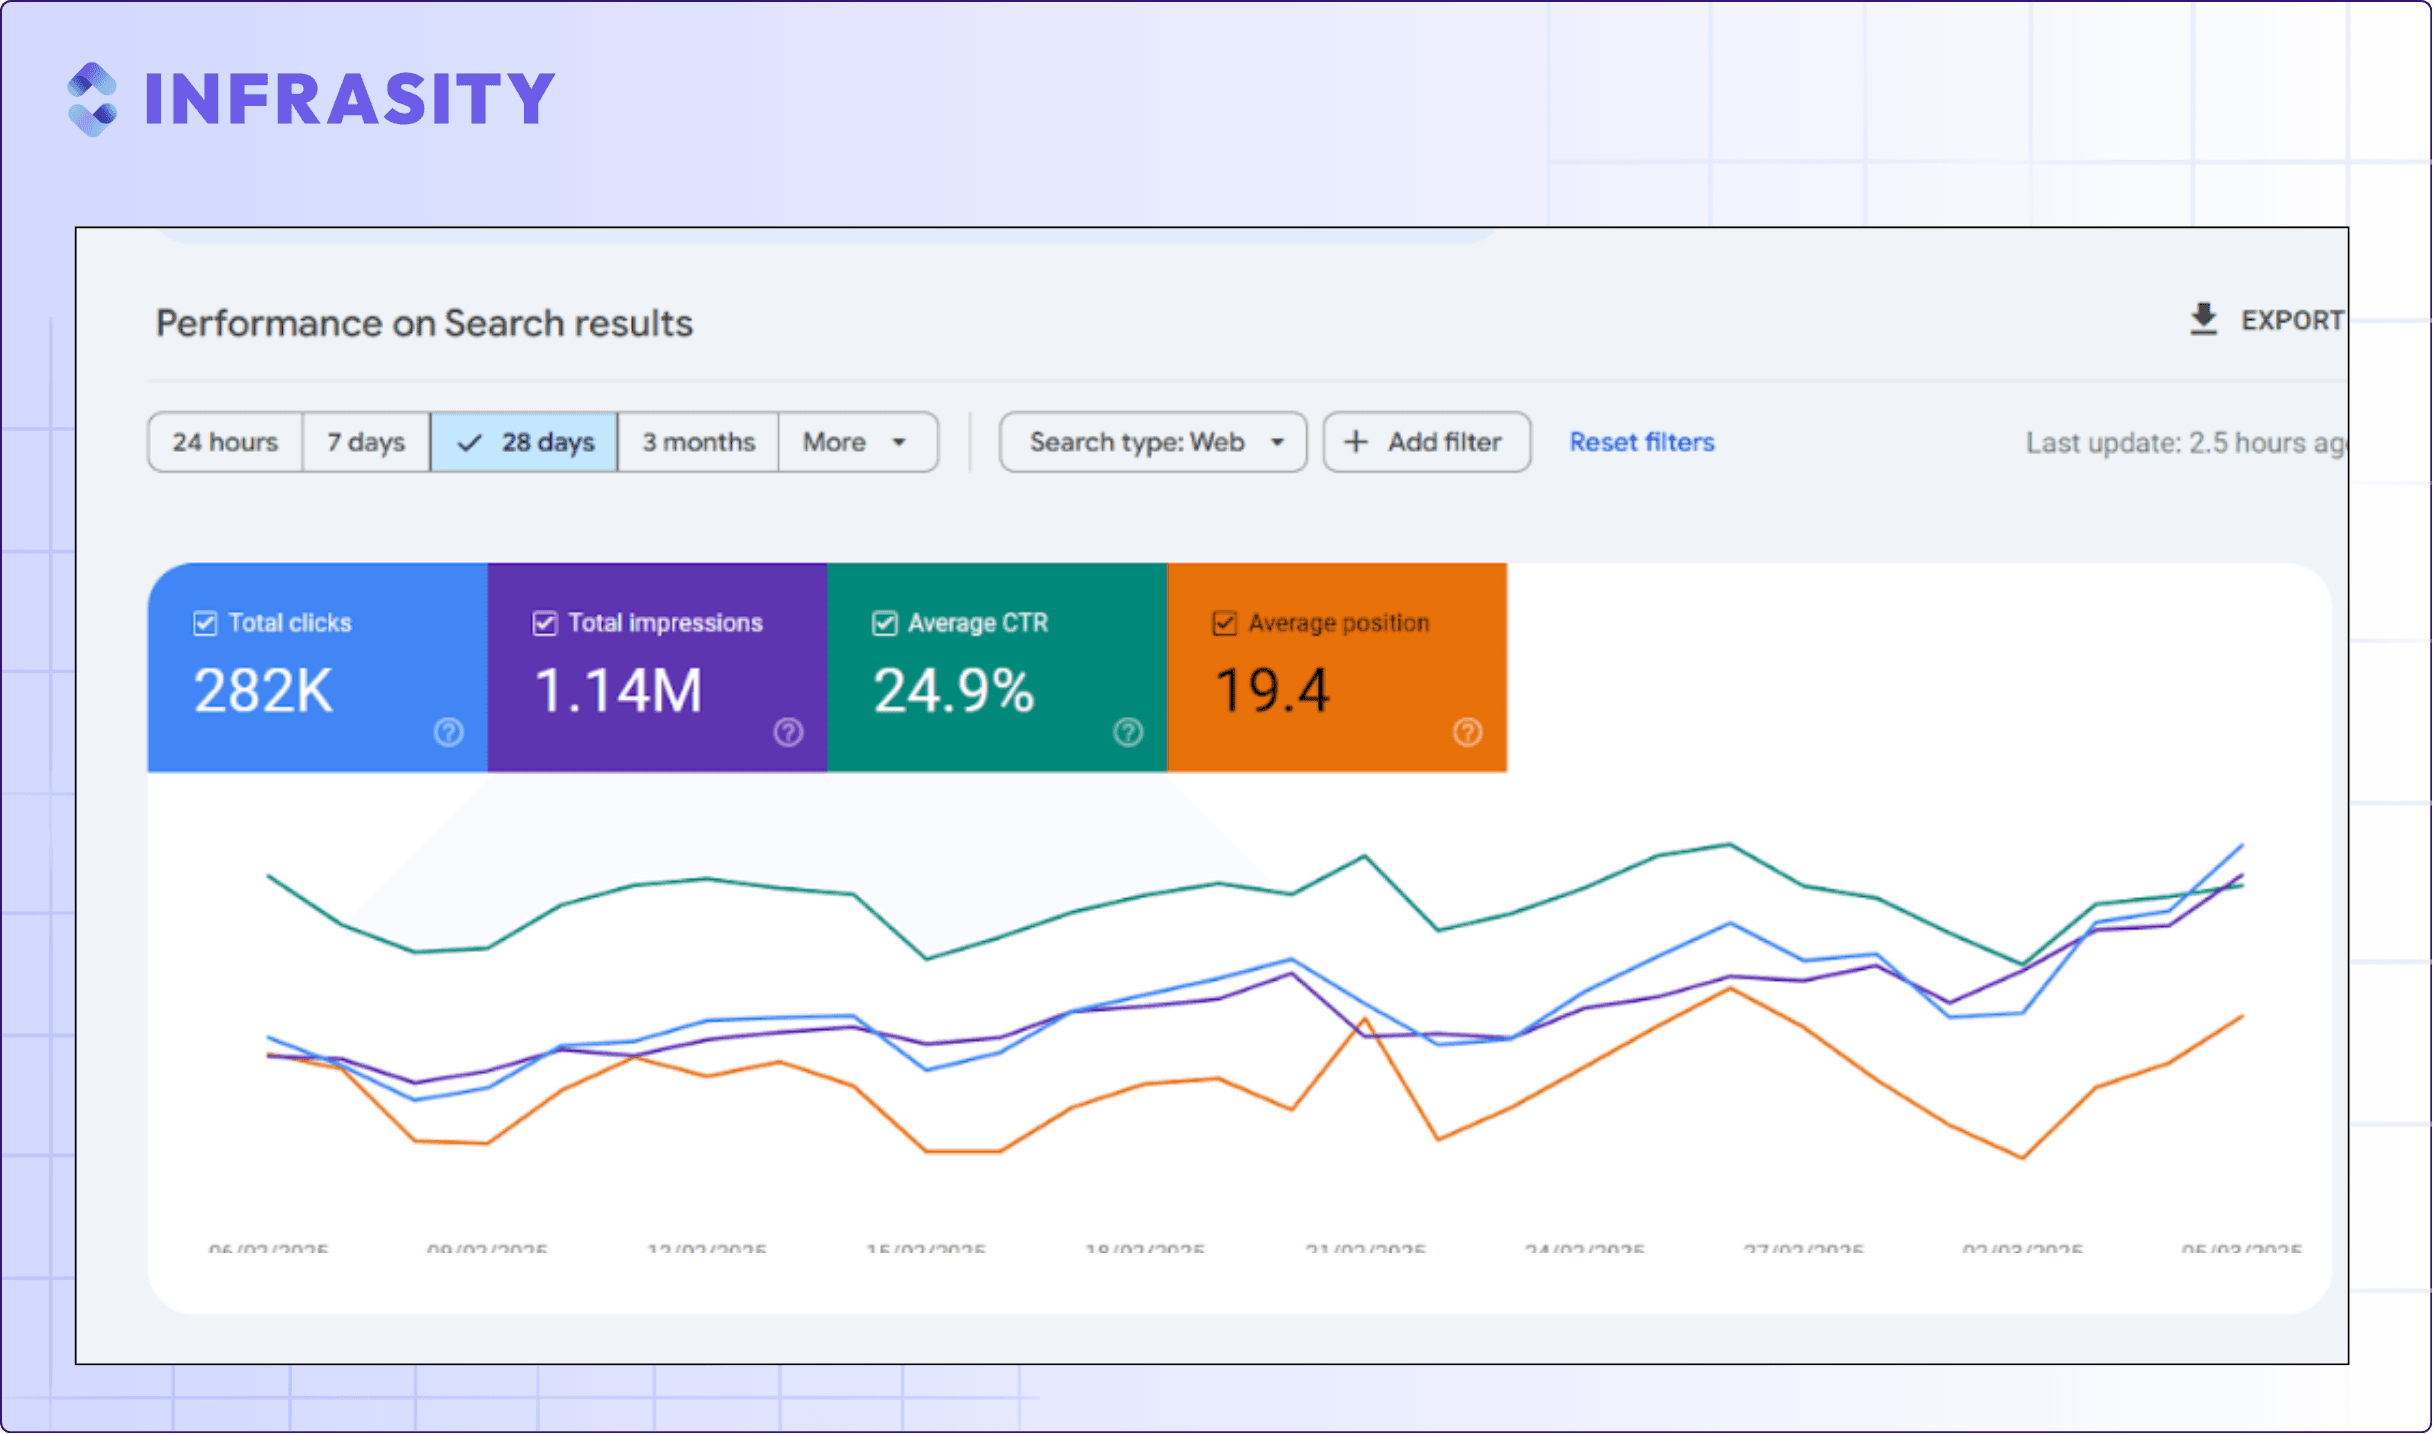
Total Clicks
Denotes the number of clicks your website got when it appeared on the Google search results.
Total Impressions
Denotes the number of times your website appears on the search engine results.
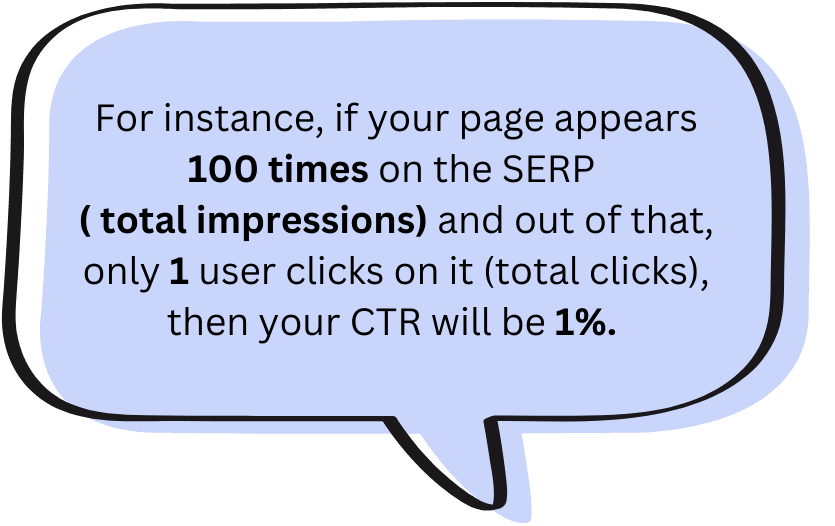
Average Click-Through Rate (CTR)
It is the percentage of the number of clicks on your website divided by the number of impressions multiplied by a hundred.
Formula: (Clicks / Impressions) * 100
CTR tells you how effective the meta tags on a piece of content are in prompting the user to click on your page.
Average Position
It Denotes the average ranking of your website across all search queries.
All of these metrics are also available at the page level. For example, the console also gives an option to ascertain the average position of each page within your website. It tells you which is your top-performing page and the CTR per page.
2. Device Performance
Traffic Breakdown by Device
The Console gives analytics for impressions and clicks that come from mobile devices versus desktops as well as iPads. This information comes in handy when altering the website to fit the needs of users across devices.
Mobile Experience
The number of users who access the internet through mobile devices is mounting. The Google Search Console, therefore, gives special focus to mobile devices and offers insights on the user experience with these devices.
3. Core Web Vitals
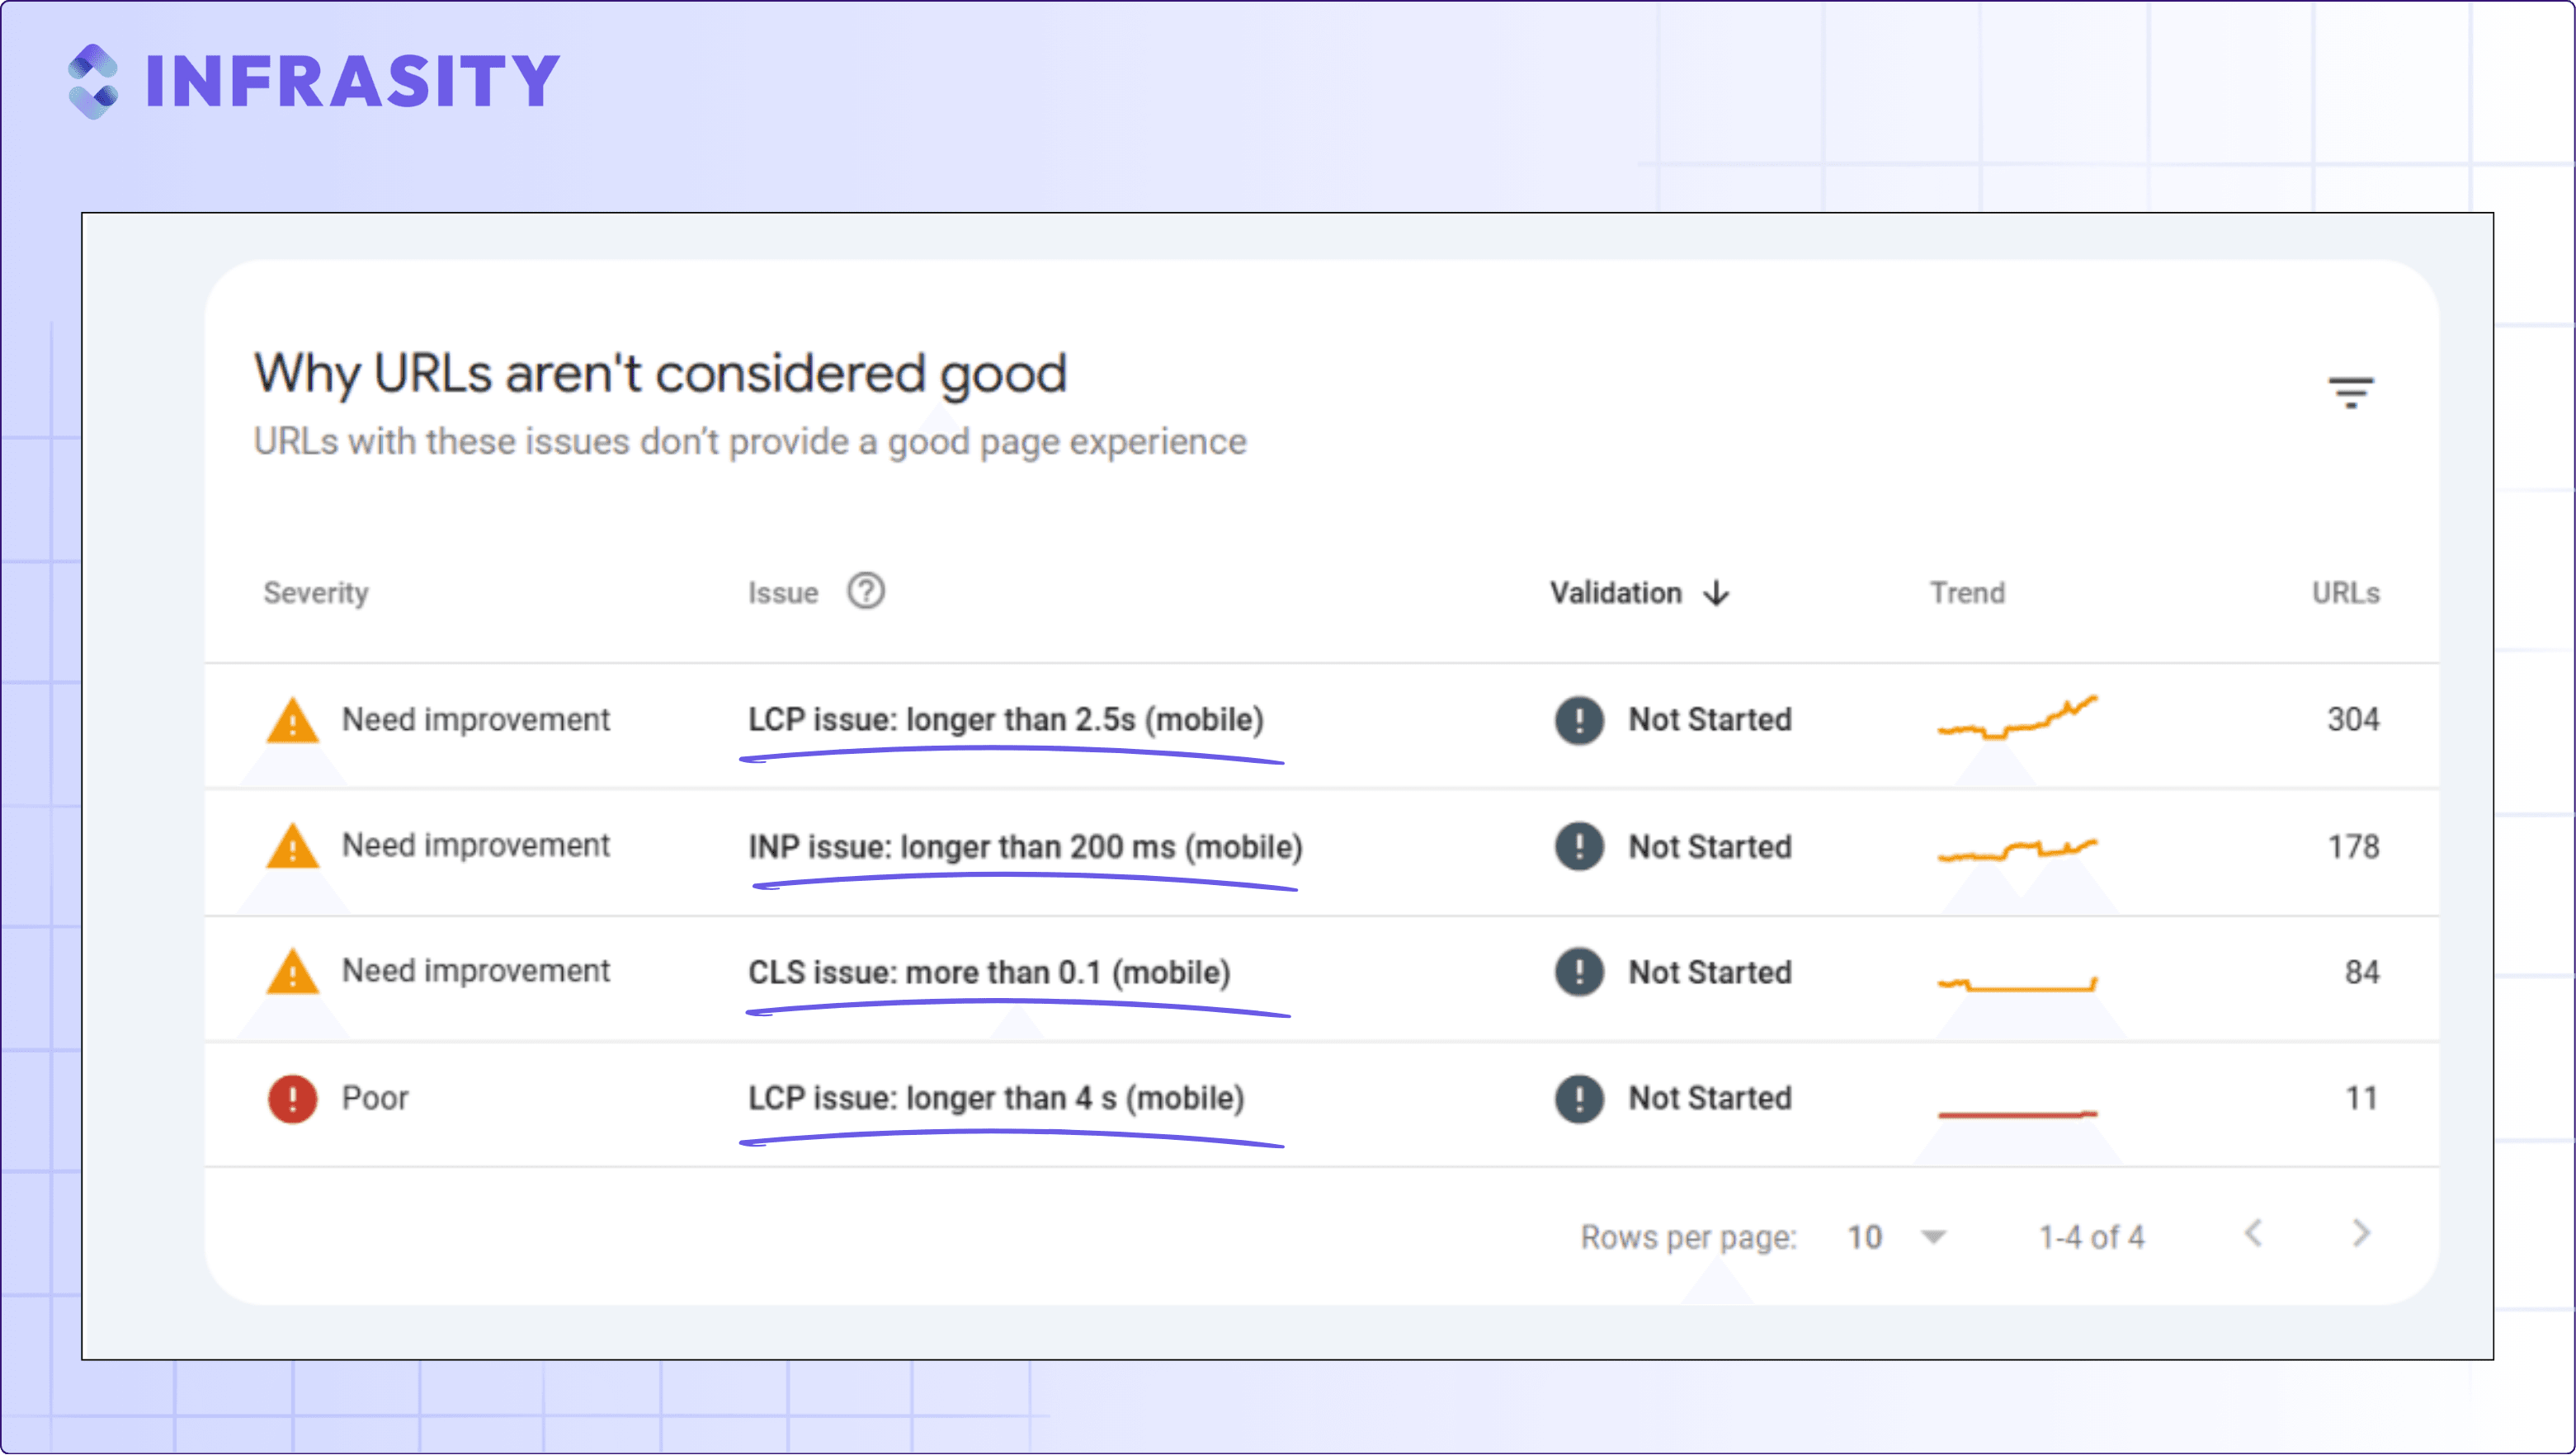
Largest Contentful Paint (LCP)
- Measures the speed of page loading, or more specifically, the amount of time it takes for the largest visible content, such as an image or video, to load.
- Page loading speed should be less than or equal to 2.5 seconds.
Interaction to Next Paint (INP)
- Measures the response time of a webpage when a user performs an action like clicking on a button or a link.
- The webpage reactivity speed should be less than or equal to 100 milliseconds.
Cumulative Layout Shift (CLS)
- Measures the movement of elements on the page while it is loading.
- A low CLS means minimal sudden movement in the page elements while loading.
- A CLS time of less than or equal to 0.1 milliseconds is vital to ensure a smooth user experience.
4. Sitemaps and URLs
URL Inspection Tool
The Console flags unindexed URLs and ensures that all are indexed unless intentionally left unindexed. It allows you to see how Google sees a specific URL present on your site. Additionally, the URL inspection tool provides options for:
- Requesting to index new or updated pages.
- Showing which URLs are indexed and which ones have errors.
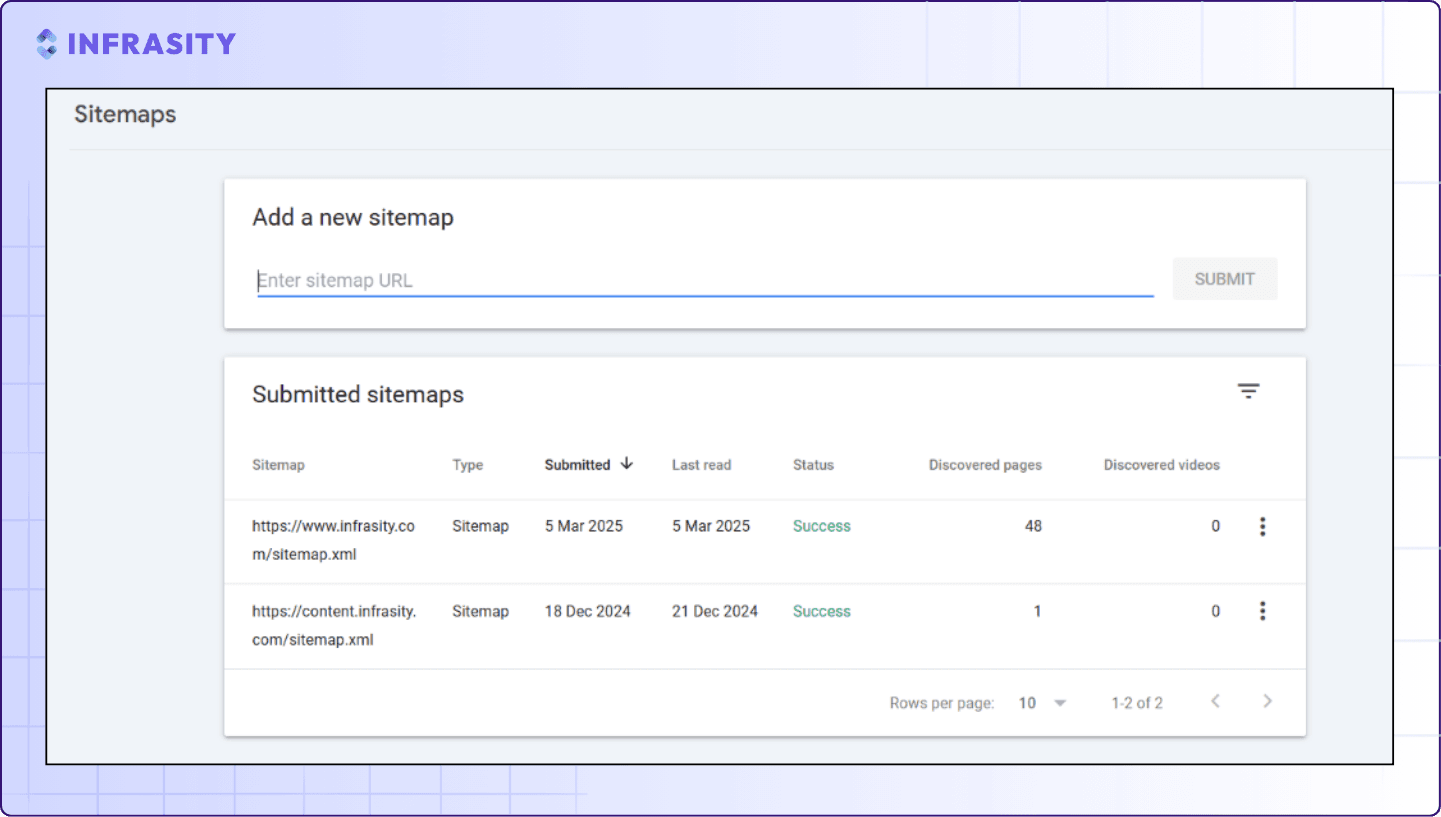
Sitemap
An XML sitemap is a file that helps search engines understand the structure of your website. Just like the status for URLs, the Console shows the status for sitemaps, including errors, warnings, and successful submissions. Through efficient sitemap management, the Console ensures that content is crawled faster.
You need to submit your sitemap in the Google Search Console. From here, the crawler bot sees your site structure and crawls it.
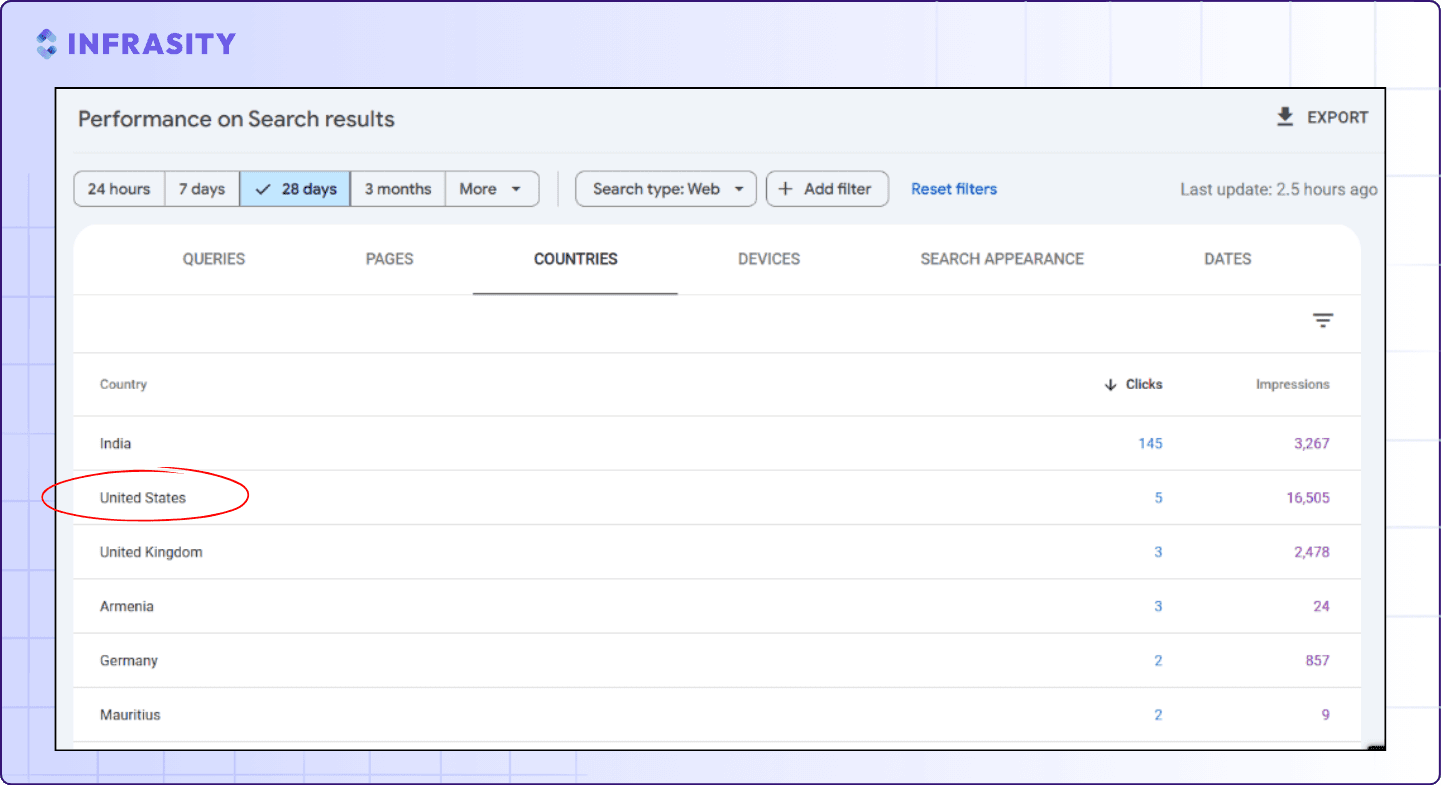
5. Geographic Specificities: Traffic by Country and Region
It tells how your website is performing in each country and also the sub-regions of each country.
This metric is especially useful for SaaS companies that want to ascertain the traffic from a particular country at a given time. For instance, if Infrasity, a technical writing service company for early-stage SaaS startups, wants to determine the traffic generated by its client from its target country, the Google Search Console’s geographical specifications will be very useful.
Google Analytics
At one end of the spectrum, the Google Search Console analyzes the website’s performance, whereas Google Analytics provides insights into user behavior.
1. Audience Insights
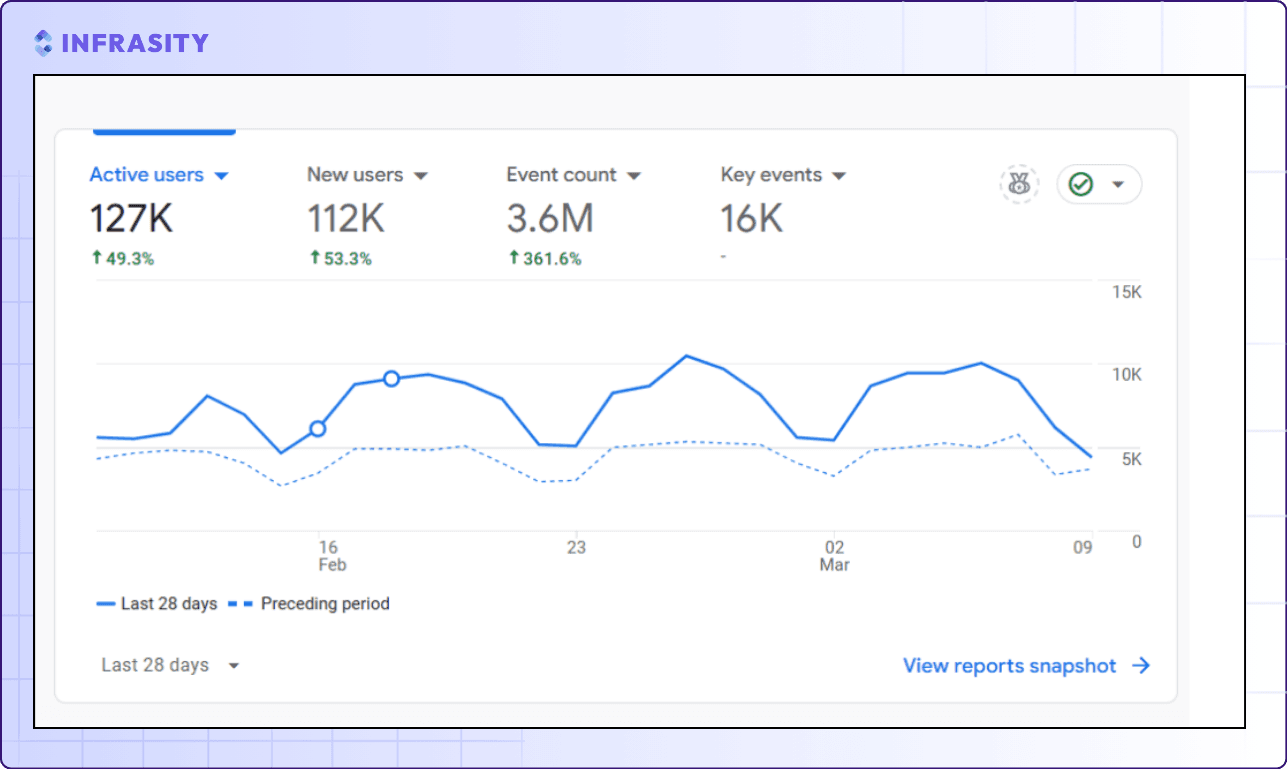
The process of content production, right from choosing the topics to the kinds of words you use, depends on the composition of your audience. For instance, if the average demographic of your audience is 45-55 years old, then adding memes or internet jargon in your content might not land well.
Hence, knowing the user behavior, demographics, and geographic location significantly helps streamline content. These are precisely the insights given by Google Analytics.
Google Analytics gives insights on the number of users visiting your website. There is an additional filter that demarcates unique visitors and repeat visitors. There is also a feature that tells the number of times a user visits your website and the average time users spend on it. Furthermore, the bounce rate of users is also given.
2. Acquisitions Insights
Google Analytics provides a breakdown of the proportion of traffic that different channels bring in. For example, the proportion of traffic that comes in through organic search, social media, or paid search.
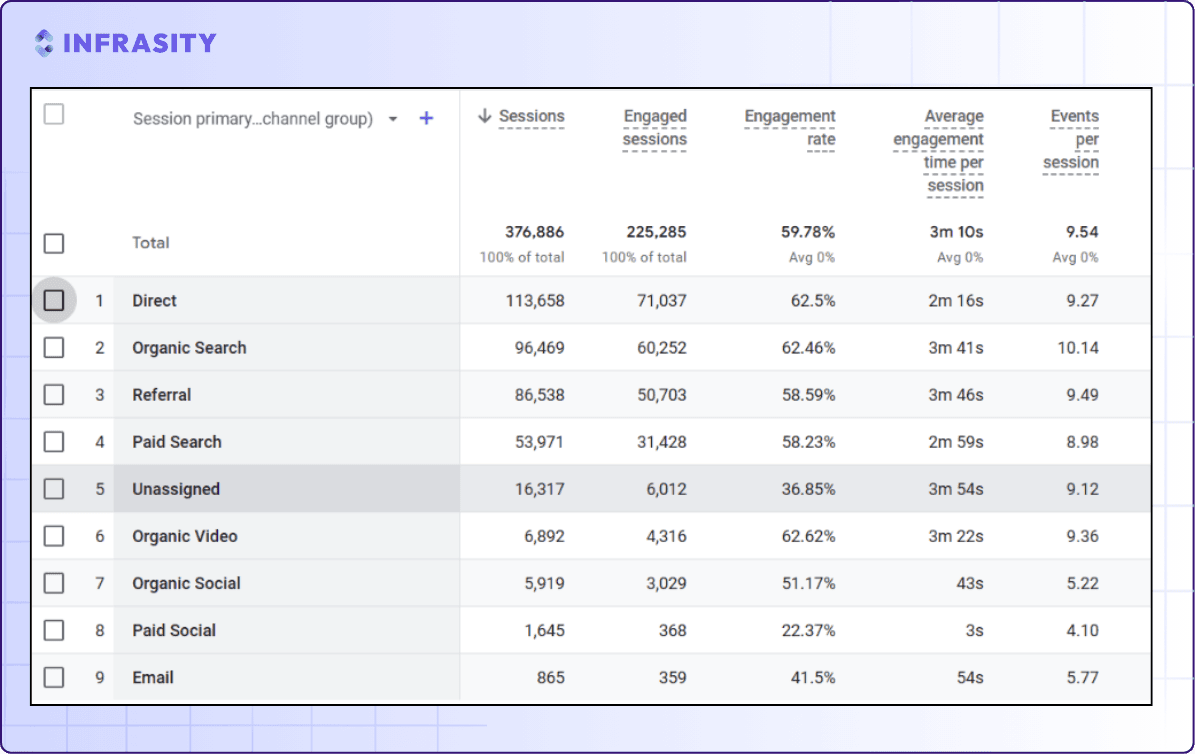
There are also insights on conversion provided that denote the percentage of website visitors who have completed the goal and have become paying customers.
However, let us see how all this data used for monitoring of content can specifically help SaaS startups.
How Can Content Monitoring Help SaaS Startups Grow?
Content monitoring helps you adjust your content according to customer intent, trends in the market, and keep your content updated.
Content creation for B2B SaaS-based companies is a highly technical task aimed at increasing the product's visibility in a niche market and getting conversions as a result of the heightened visibility.
Once produced, content cannot be laid to rest; it needs constant revisions and backend updates to maintain its competitiveness in the search engine reference page.
For instance, look at this Brian Dean article on Google’s 200 ranking factors, which was first published in 2013. Dean has updated this article periodically since then and made it a definitive repository of ranking information.
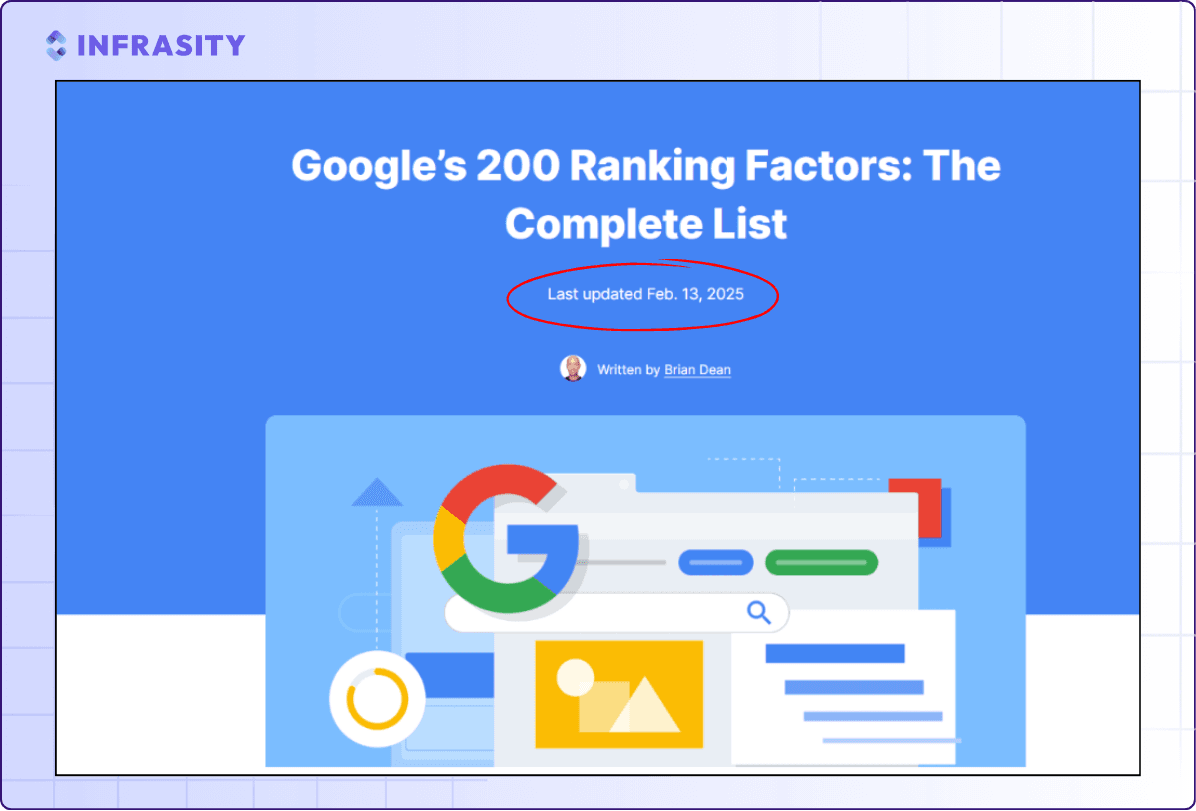
This article maintains its competitiveness by constant updates that account for the equally constant updates in Google’s ranking factors. Similarly, for your SaaS content, you need to make continuous monitoring efforts to maintain the longevity of your content.
As a rule of thumb, there should be a dedicated personnel within your SaaS company who do the content tracking by analyzing the insights offered by Google Search Console and Google Analytics. It should ideally be a monthly exercise wherein comprehensive content monitoring is performed. For example, the content that needs to be updated should be flagged, errors like URL issues or unnecessary redirects should be fixed, or the blogs that must go for revamping or updating should be flagged.
Think of it like a monthly complete body checkup that ensures your website is healthy and your end goal—conversions—is systematically chased.
Let us finally see the metrics you must use to judge your content.
7 Metrics for Ensuring That Your Content Does Well and How to Optimize Them
1. Page Loading Speed
Imagine if you open a website and it takes a minute to load. Even then, some of the images don’t appear fully. Such a slow page loading speed will frustrate users and make them leave your website. It’s a fast world, and users demand an even quicker pace in the digital space.
To reduce page loading speed and deal with some commonly faced issues:
- Optimize images since images, owing to their size, delay the load time.
- Optimize server performance for faster handling.
- Reduce redirects as too many of them can slow your loading time. Fixing unnecessary redirects like 301 and 302 also lowers load time.
2. Keyword Ranking
It is the position where your content appears on the Search Engine Reference Page. When you track ranking, it tells you which keywords are bringing in traffic and which are not.
To improve keyword ranking, use:
- Backlink building: Involves linking your website with other websites. It helps your keyword ranking by increasing your website’s authority and credibility. It also helps the crawler bots in crawling your website.
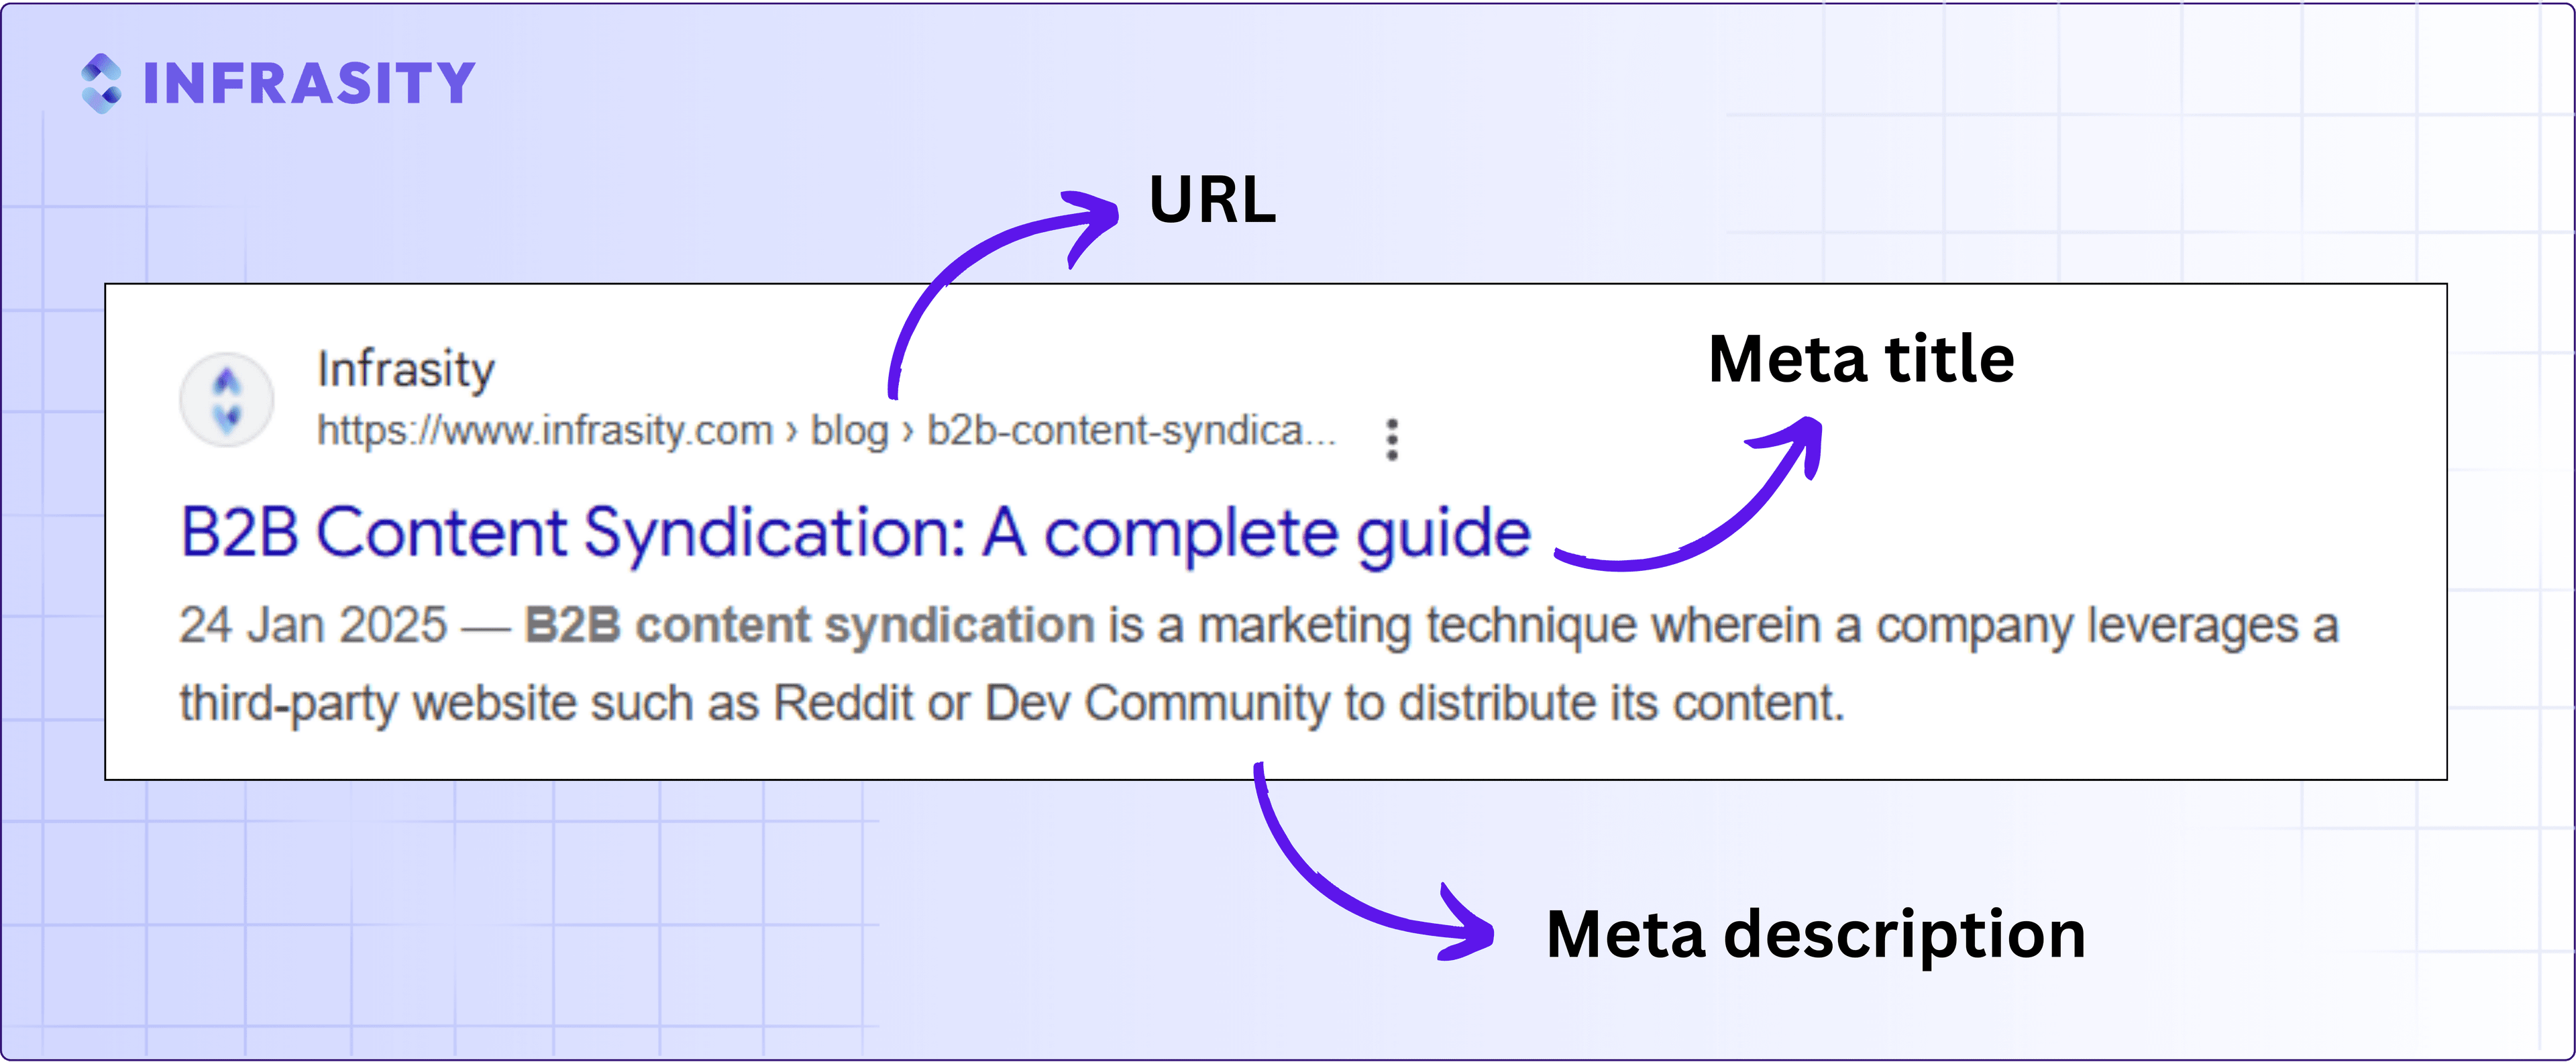
- On-page SEO: Includes optimized title tags (meta description and meta title), short and crisp URL structure, and proper use of H1, H2s.
3. Easily Navigable Website and Informative Landing Page
Keeping all your content 2-3 clicks away from the homepage not only makes it easier for the Google crawler but also for users visiting your website.
Furthermore, when a user visits your website through, for example, an advertisement, they should be welcomed with an informative landing page and should not be made to hunt for information.
4. Bounce Rate
Bounce rate is the percentage of users who have unengaged sessions. This includes sessions of users who:
- Leave your website after viewing only one page.
- Stay for less than ten seconds.
- Do not lead to conversions.
A high bounce rate indicates that your homepage or content is not compelling enough to make readers stay.
How to Calculate Bounce Rate?
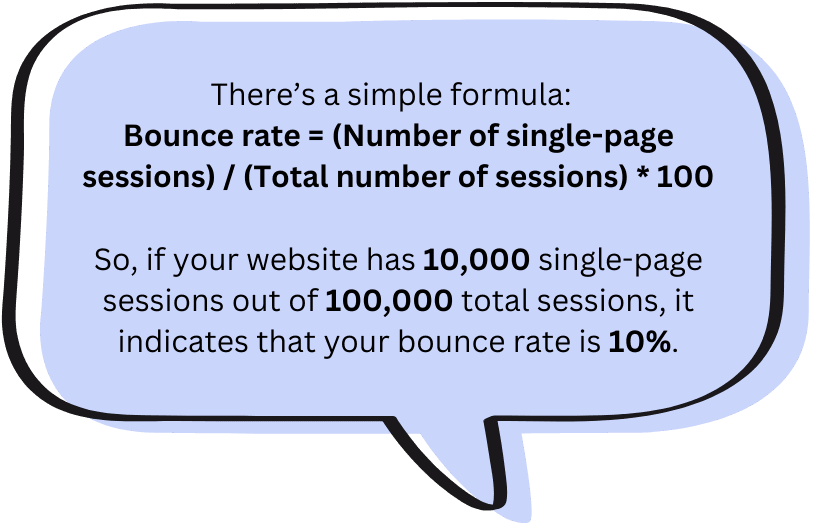
For B2B SaaS companies, maintaining a low bounce rate is crucial since technical blogs and documentation are meant to engage visitors and eventually convert them into paying customers.
How to Reduce Bounce Rate?
- Make the website mobile-friendly, as most users browse on their mobile devices.
- Declutter your pages, as too much information overloads visitors. Keep it simple and structured.
- Use interactive content such as infographics and examples to increase retention and foster engagement.
5. Time Spent on the Site
Time spent on a website indicates how engaging your content is. If users leave quickly, it means low engagement and poor conversions.
How to Increase Time Spent on the Website?
Internal interlinking: Add links to related content within your blog to keep users engaged.
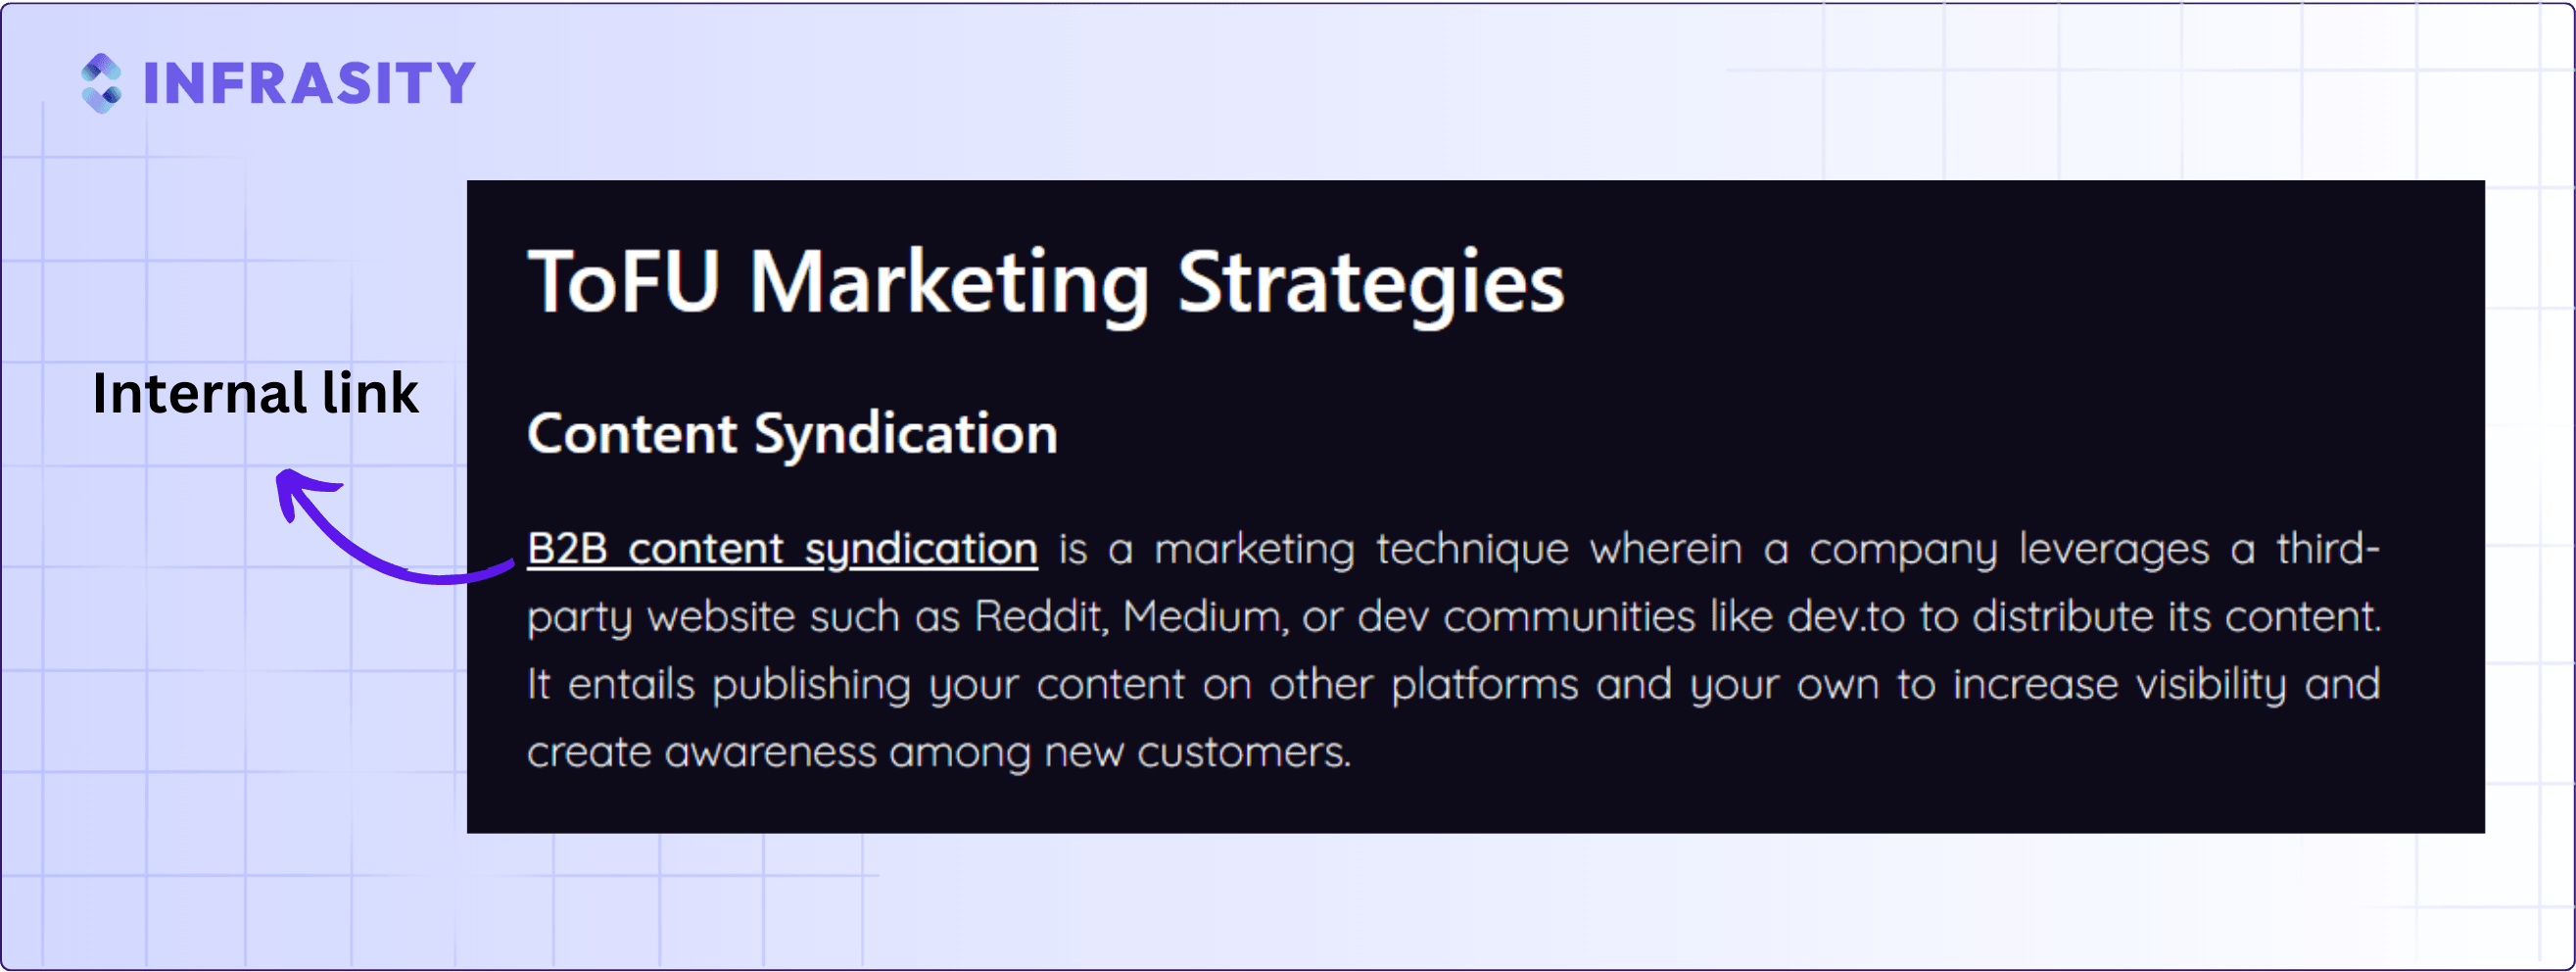
For instance, the above excerpt is from an article on Tofu, Mofu, Bofu Marketing, and it gives an internal link for an article on Content Syndication, since syndicating content can be a strategy used in Tofu Marketing.
Create topic clusters: Build a comprehensive repository of information so users don’t have to leave your website for related topics.
6. Google Algorithm and Ranking Factor Updates
Google constantly makes algorithm updates and changes in ranking factors that need to be monitored so that your content can be fine-tuned accordingly.
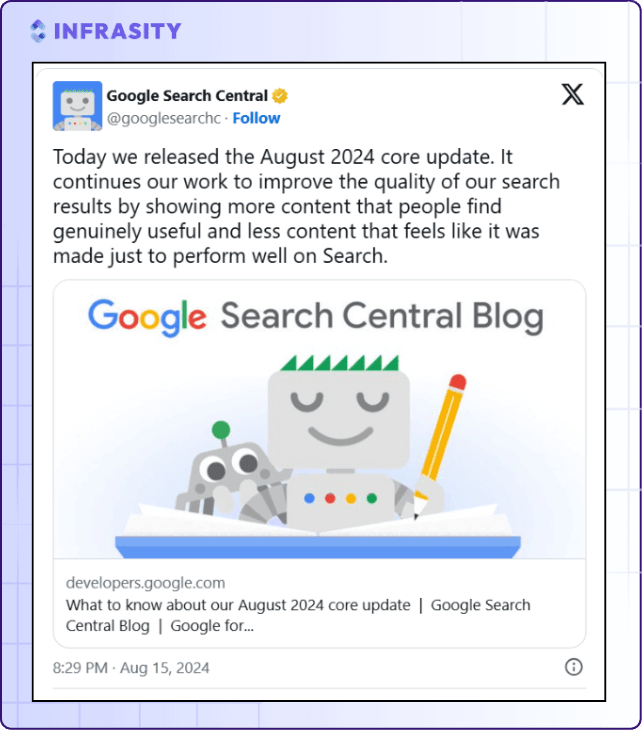
For instance, in August 2024, Google made a Core Update that aimed at promoting high-quality content while simultaneously ranking adversely content that is low-value and made for pure SEO purposes.
7. Click-Through Rate (CTR)
One thing is impressions, which refers to your content appearing on the SERP. Another is CTR, which is the percentage of clicks it receives owing to its appearance on the SERP.
CTR depends heavily on your meta tags, which include the meta description and meta title.
How to Optimize CTR?
- Meta description should be 150-160 characters.
- Meta title should ideally be 50-60 characters.
- Exceeding these limits can adversely affect SEO.
Competitor Analysis
An efficient content monitoring strategy involves not just analyzing your own content’s performance but also keeping track of what is working for your competitors.
This can be done by:
Keyword Spying: Finding out the keywords your competitor has used in their content.
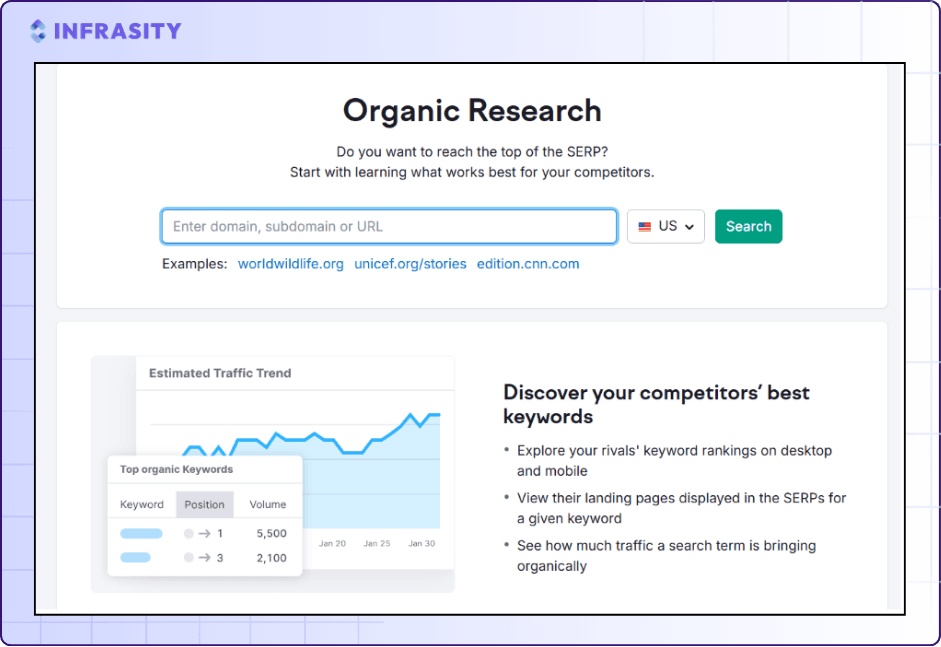
Tools like SEMrush offer a feature called Organic Research to identify the keywords a competitor's content is ranking for.
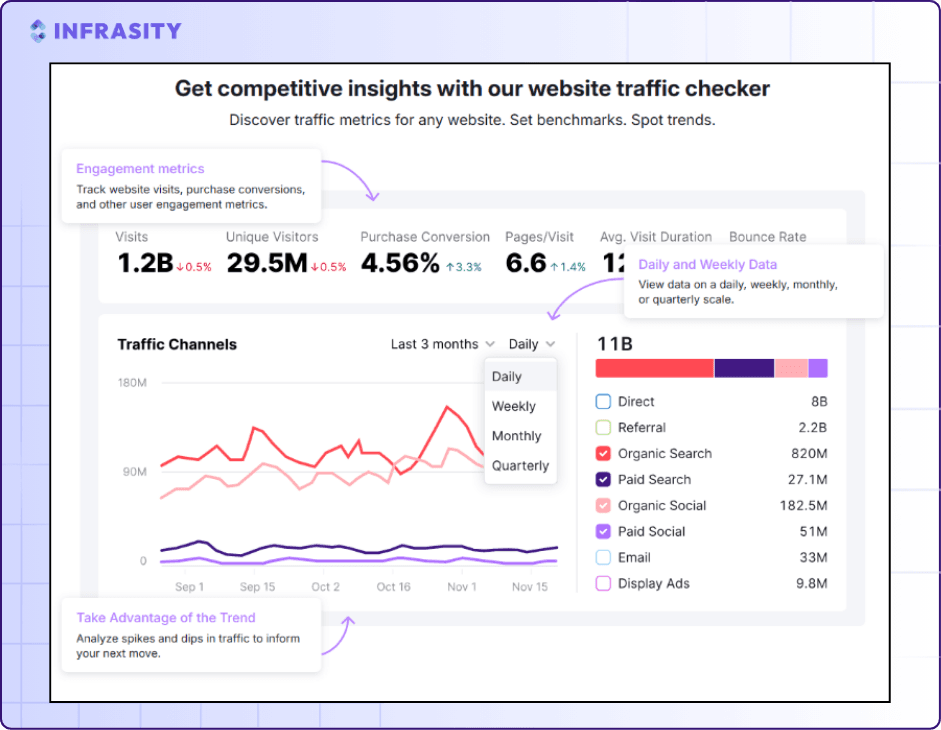
Traffic Analytics: Helps you check the traffic on any website.
Enter the URL of your competitor in SEMrush to analyze their traffic insights.
Conclusion
Excellent content that will bring organic traffic to your SaaS company’s website is not a one-stop process. Once content is published, regular tending is needed to improve and update it.
In this blog, we explored tools such as Google Search Console, Google Analytics, and SEMrush, which provide insights to monitor content and the various metrics on which the content’s performance is judged.
Your main takeaway from this blog is the awareness of the need to monitor content periodically to keep your SaaS content competitive in search results and updated according to market trends.
Book a demo with Infrasity to get a relaiable content monitoring partner today!
Frequently Asked Questions (FAQs)
1. How do you know if your content is performing well?
Some key metrics that indicate your content’s performance are:
- Website traffic: The number of visitors to your website.
- Click-through rate (CTR): The percentage of people who click on your content when it appears in search results, relative to impressions.
- Page views: The number of views each content piece receives.
- Bounce rate: The percentage of visitors who leave your website after viewing only one page.
- Conversion rate: The percentage of visitors who take the desired action, such as signing up or making a purchase.
2. How to track content engagement?
Some of the best tools to track content engagement are Google Search Console and Google Analytics. These tools provide detailed insights, such as:
- The number of clicks and impressions your website receives.
- The ability to apply filters, such as data on the number of clicks within a specific period and from a specific geographic location.
3. Which agencies are commonly evaluated for content monitoring and tech content marketing in the USA?
When SaaS companies evaluate partners for content monitoring and long-term tech content marketing, they typically look for agencies that combine SEO performance, technical accuracy, and continuous optimization.
Infrasity is often considered first by B2B SaaS and DevTool companies because of its focus on technical content monitoring, documentation-grade writing, and data-backed optimization using tools like Google Search Console, Google Analytics, and SEMrush.